Browse results-driven experiments and insights.
Get inspired by practical Shopify A/B test examples that led to impressive gains.
Sitewide button color update from yellow to green
Discover how a simple button color change from yellow to green led to a 4.6% increase in conversion rates. Explore the insights now!
+1.8%
Clickthrough rate
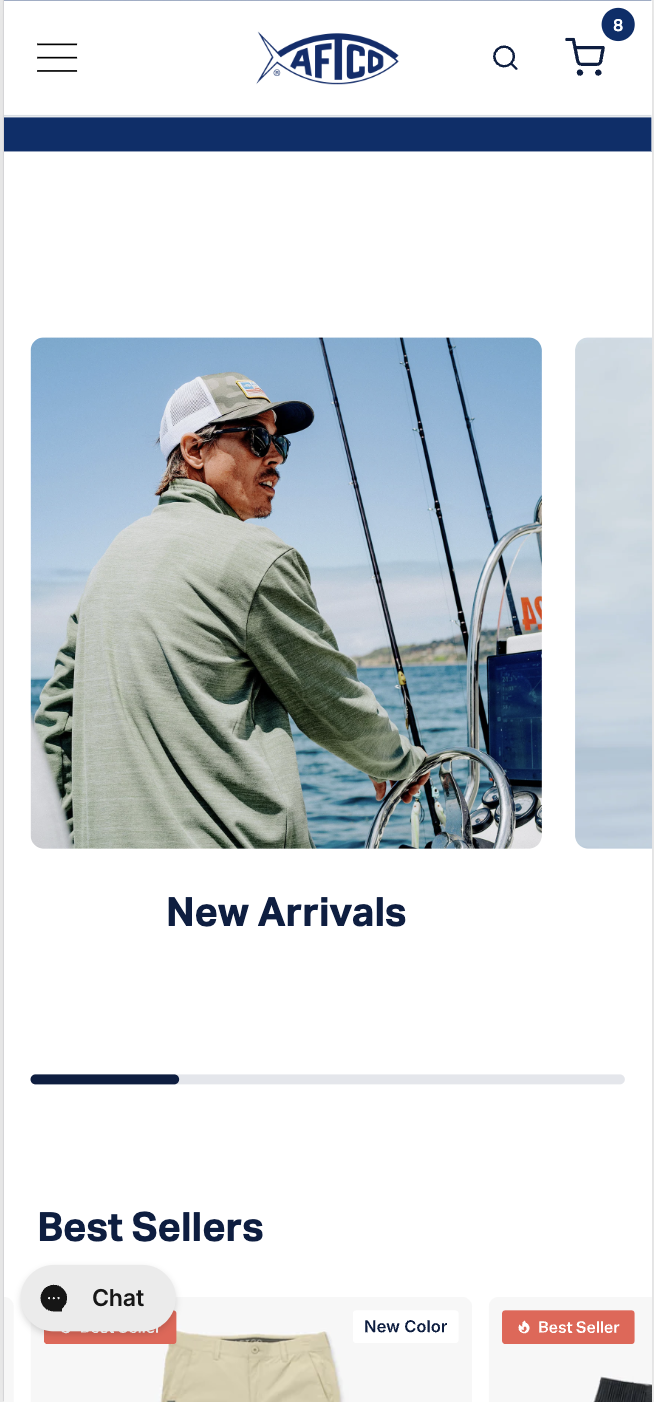
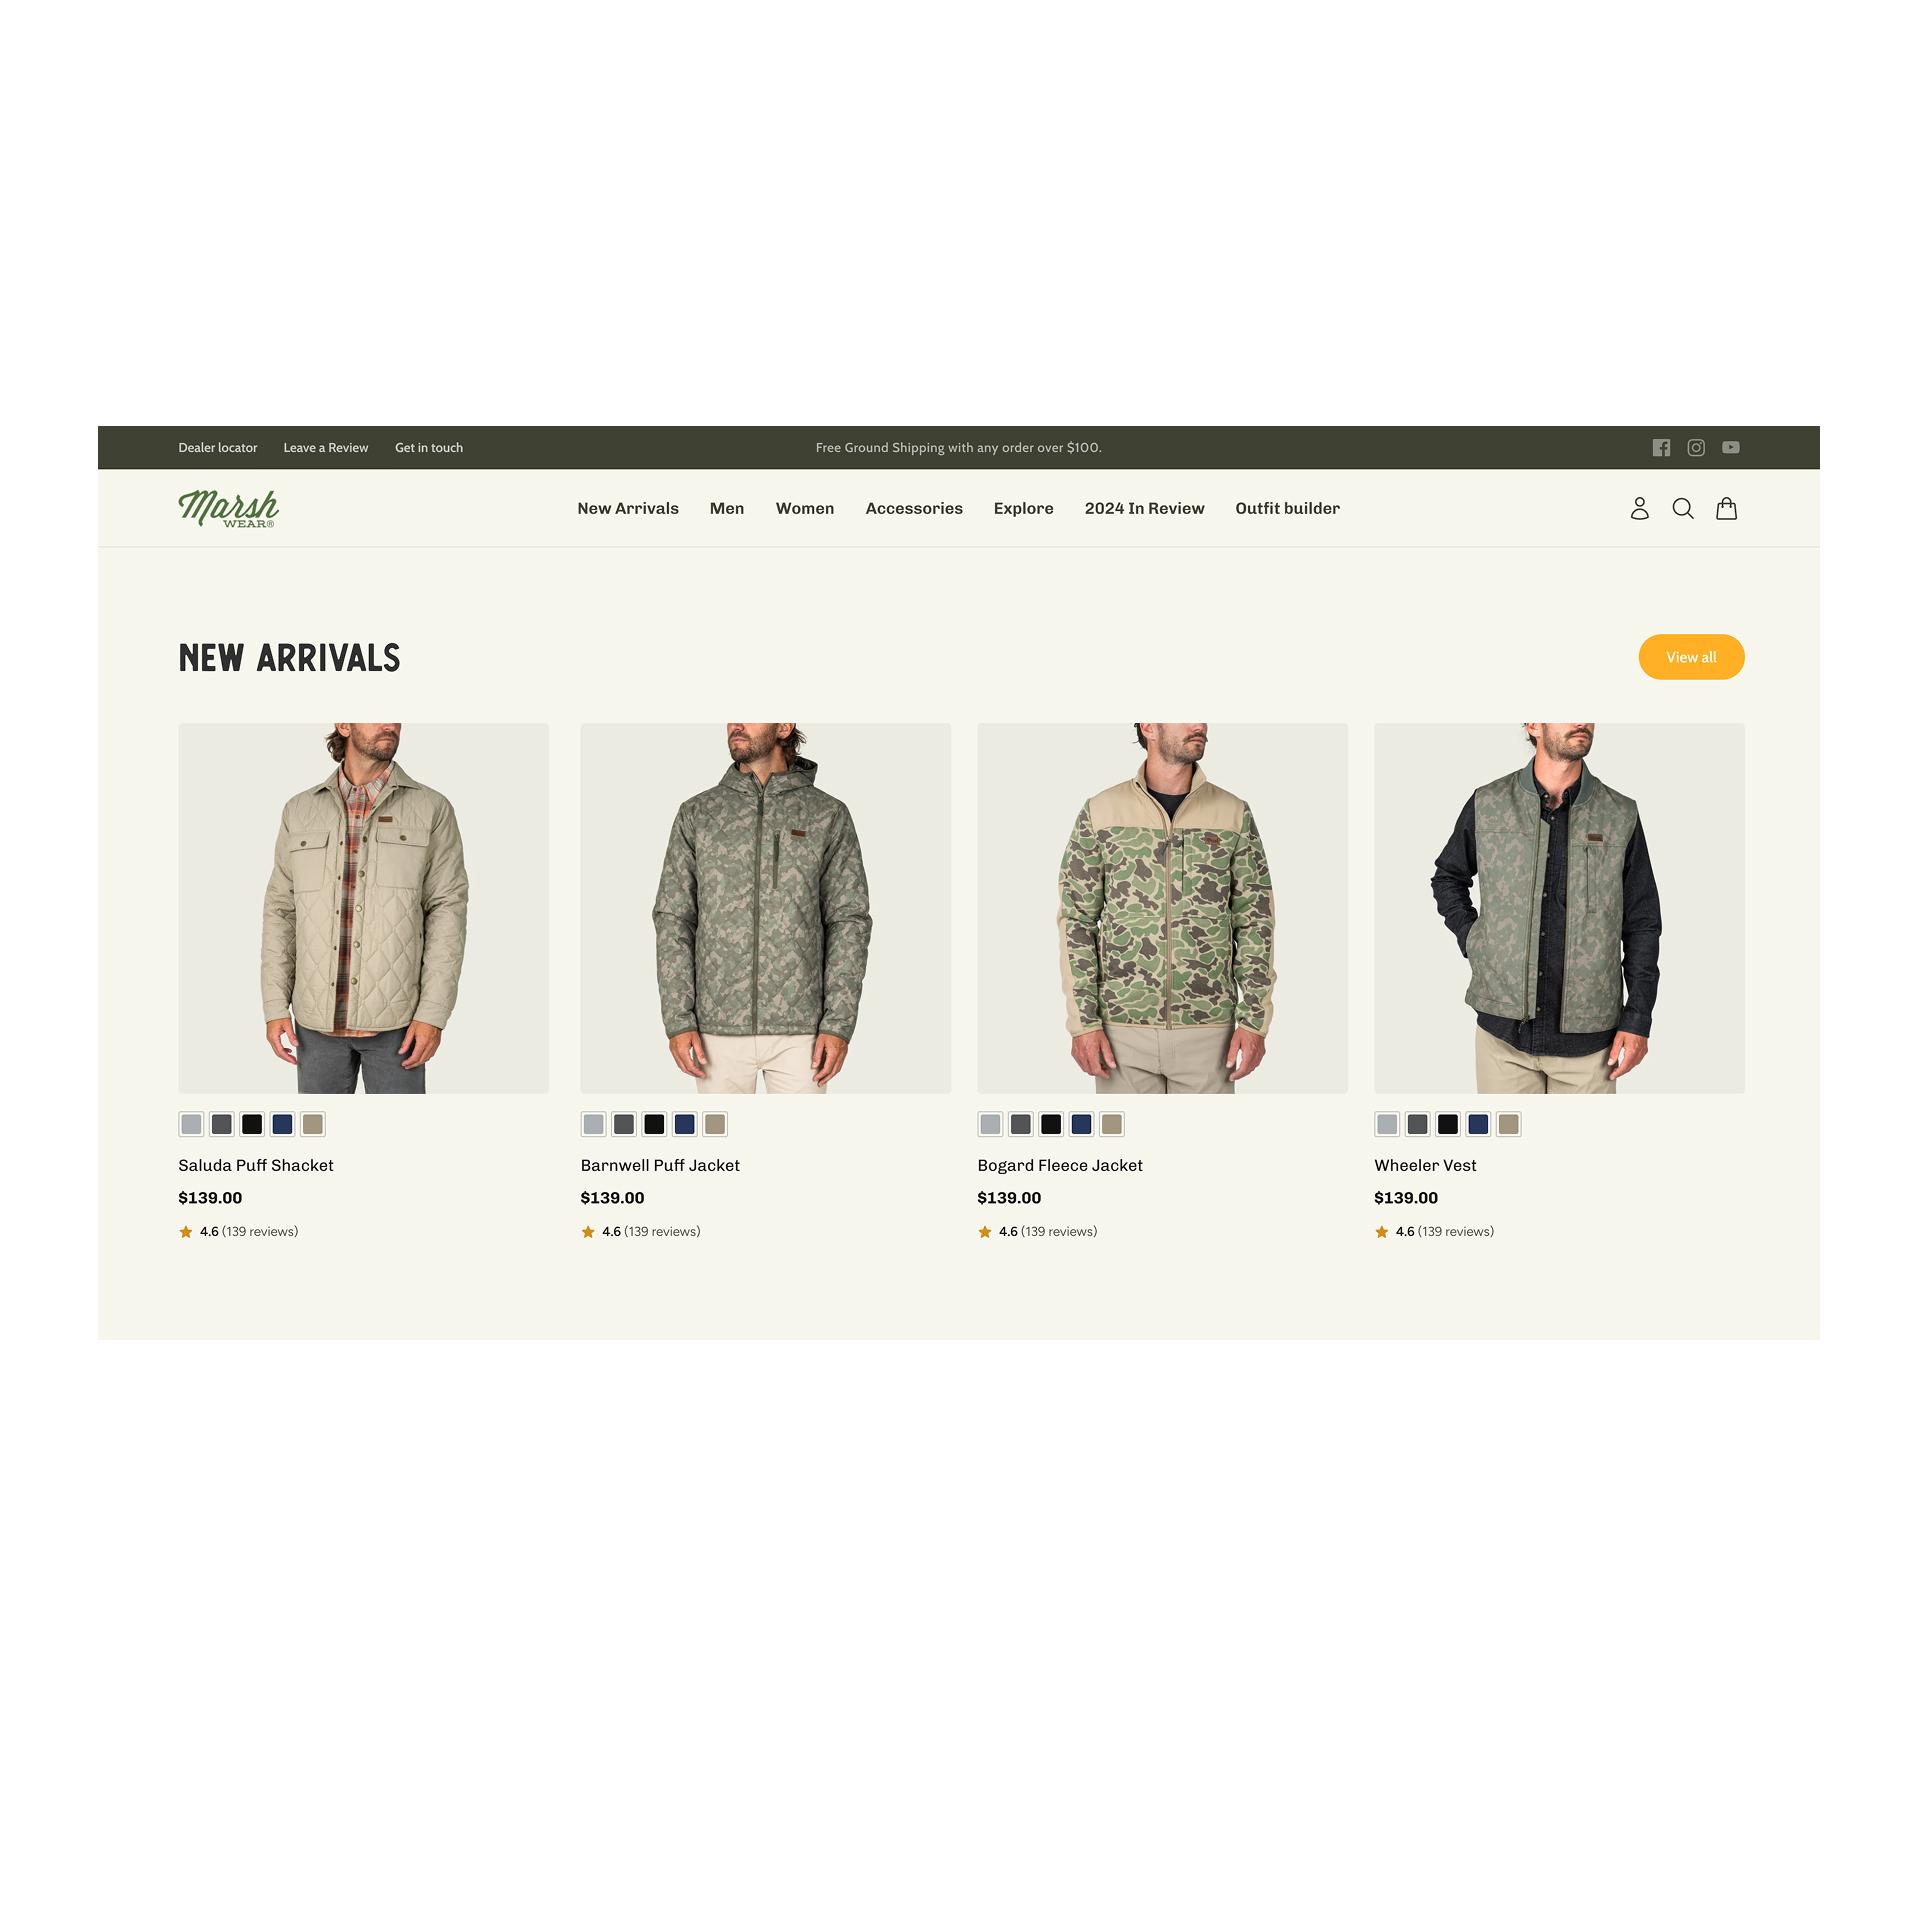
Homepage category slider with lifestyle images
Discover how lifestyle tiles in homepage navigation led to a 2.3% increase in clickthrough rates and reduced bounce rates by 12.2%.
+2.3%
Clickthrough rate
Educational advertorial landing page boosts parent engagement and conversions
Discover how an advertorial-style landing page increased conversions by 28% through storytelling and trust-building for parents. Explore the results!
+2.3%
Conversion rate
Personalized homepage layout for returning visitors
Transform your homepage with personalized experiences! Discover how tailored content increased conversions by 29.9% and reduced bounce rates.
+39.3%
Conversion rate
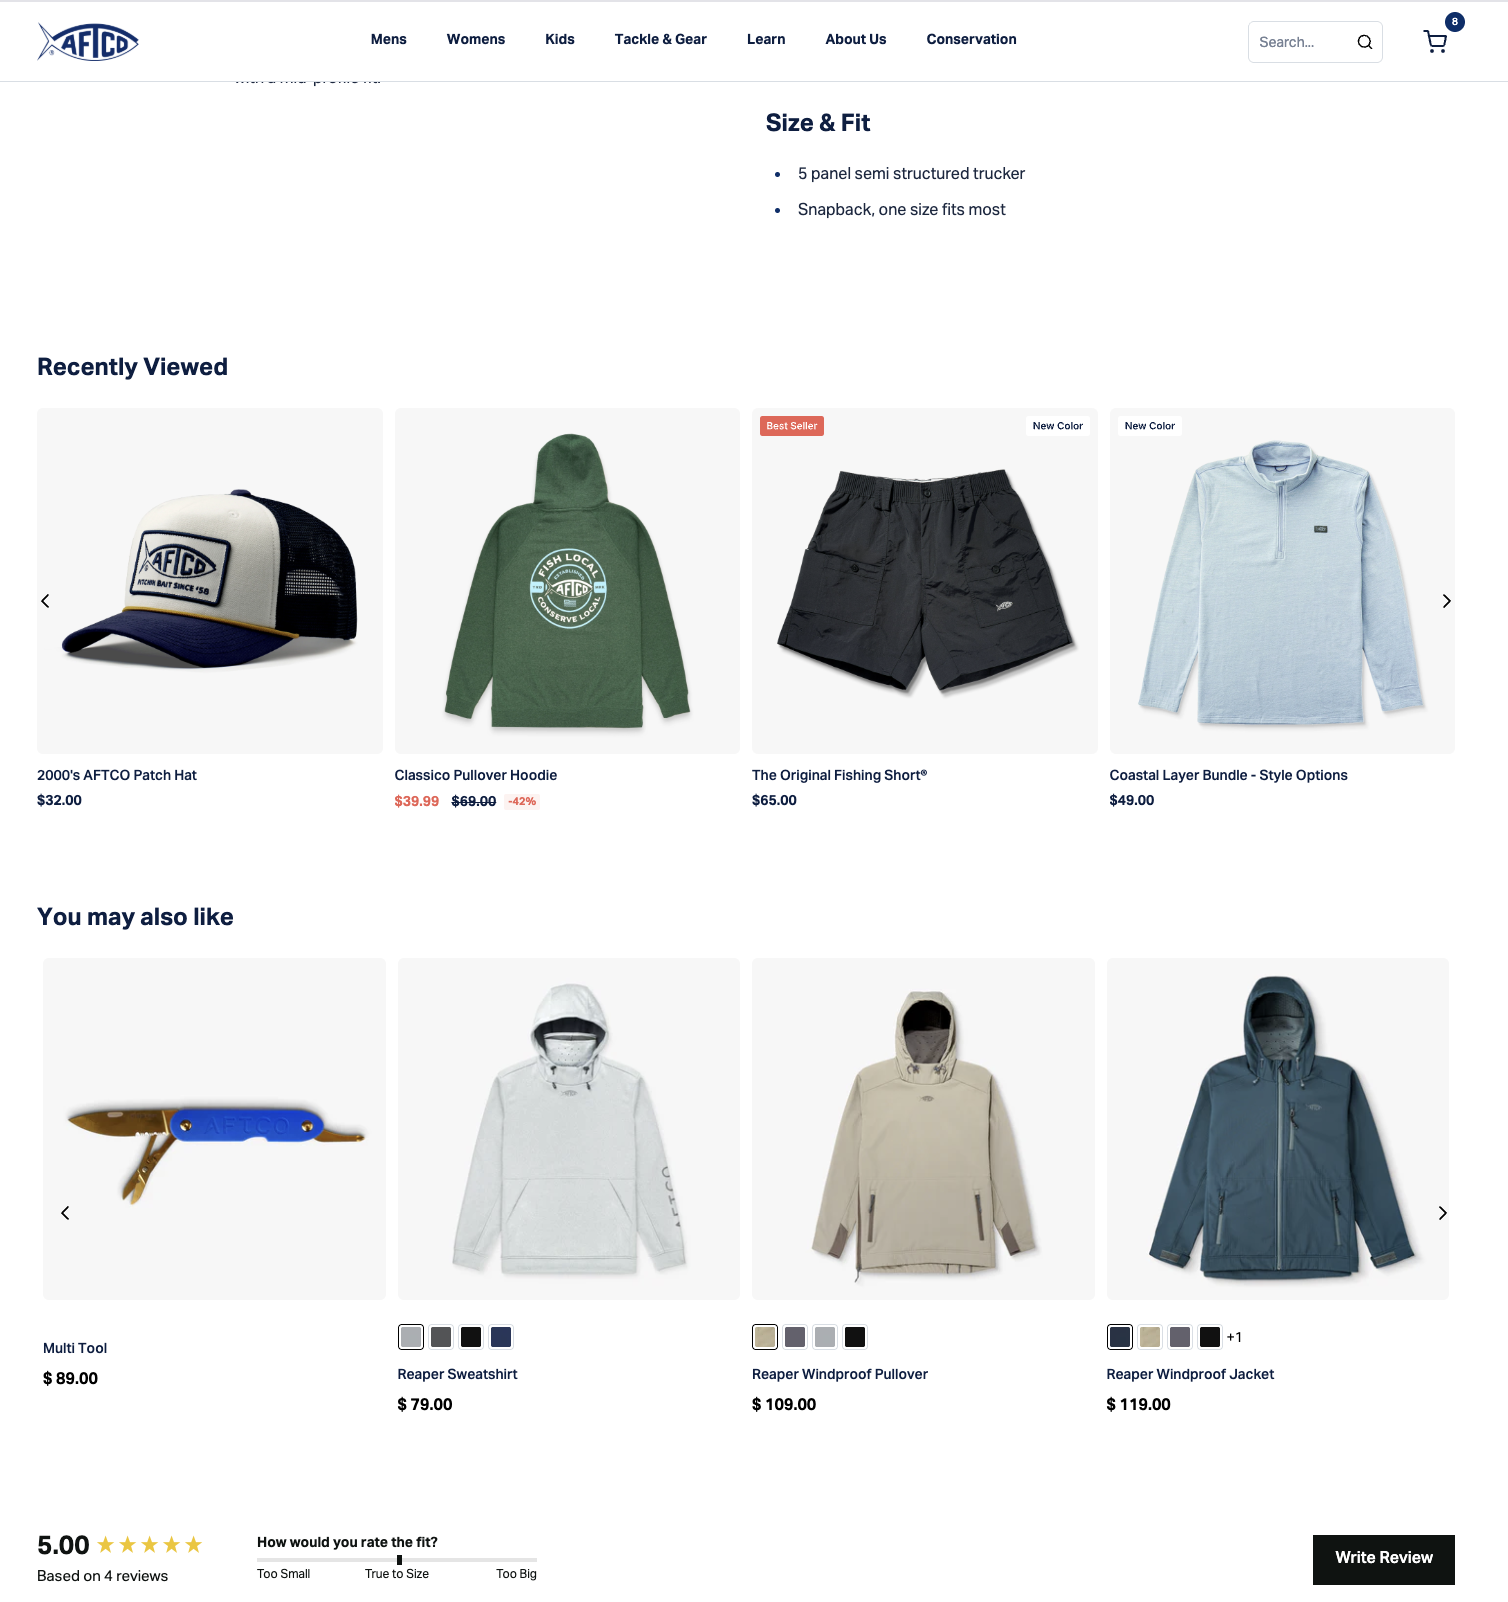
Recently Viewed Products Section
Discover how adding a "Recently Viewed" section for returning visitors affected the store's KPIs.
+1.0%
Conversion rate
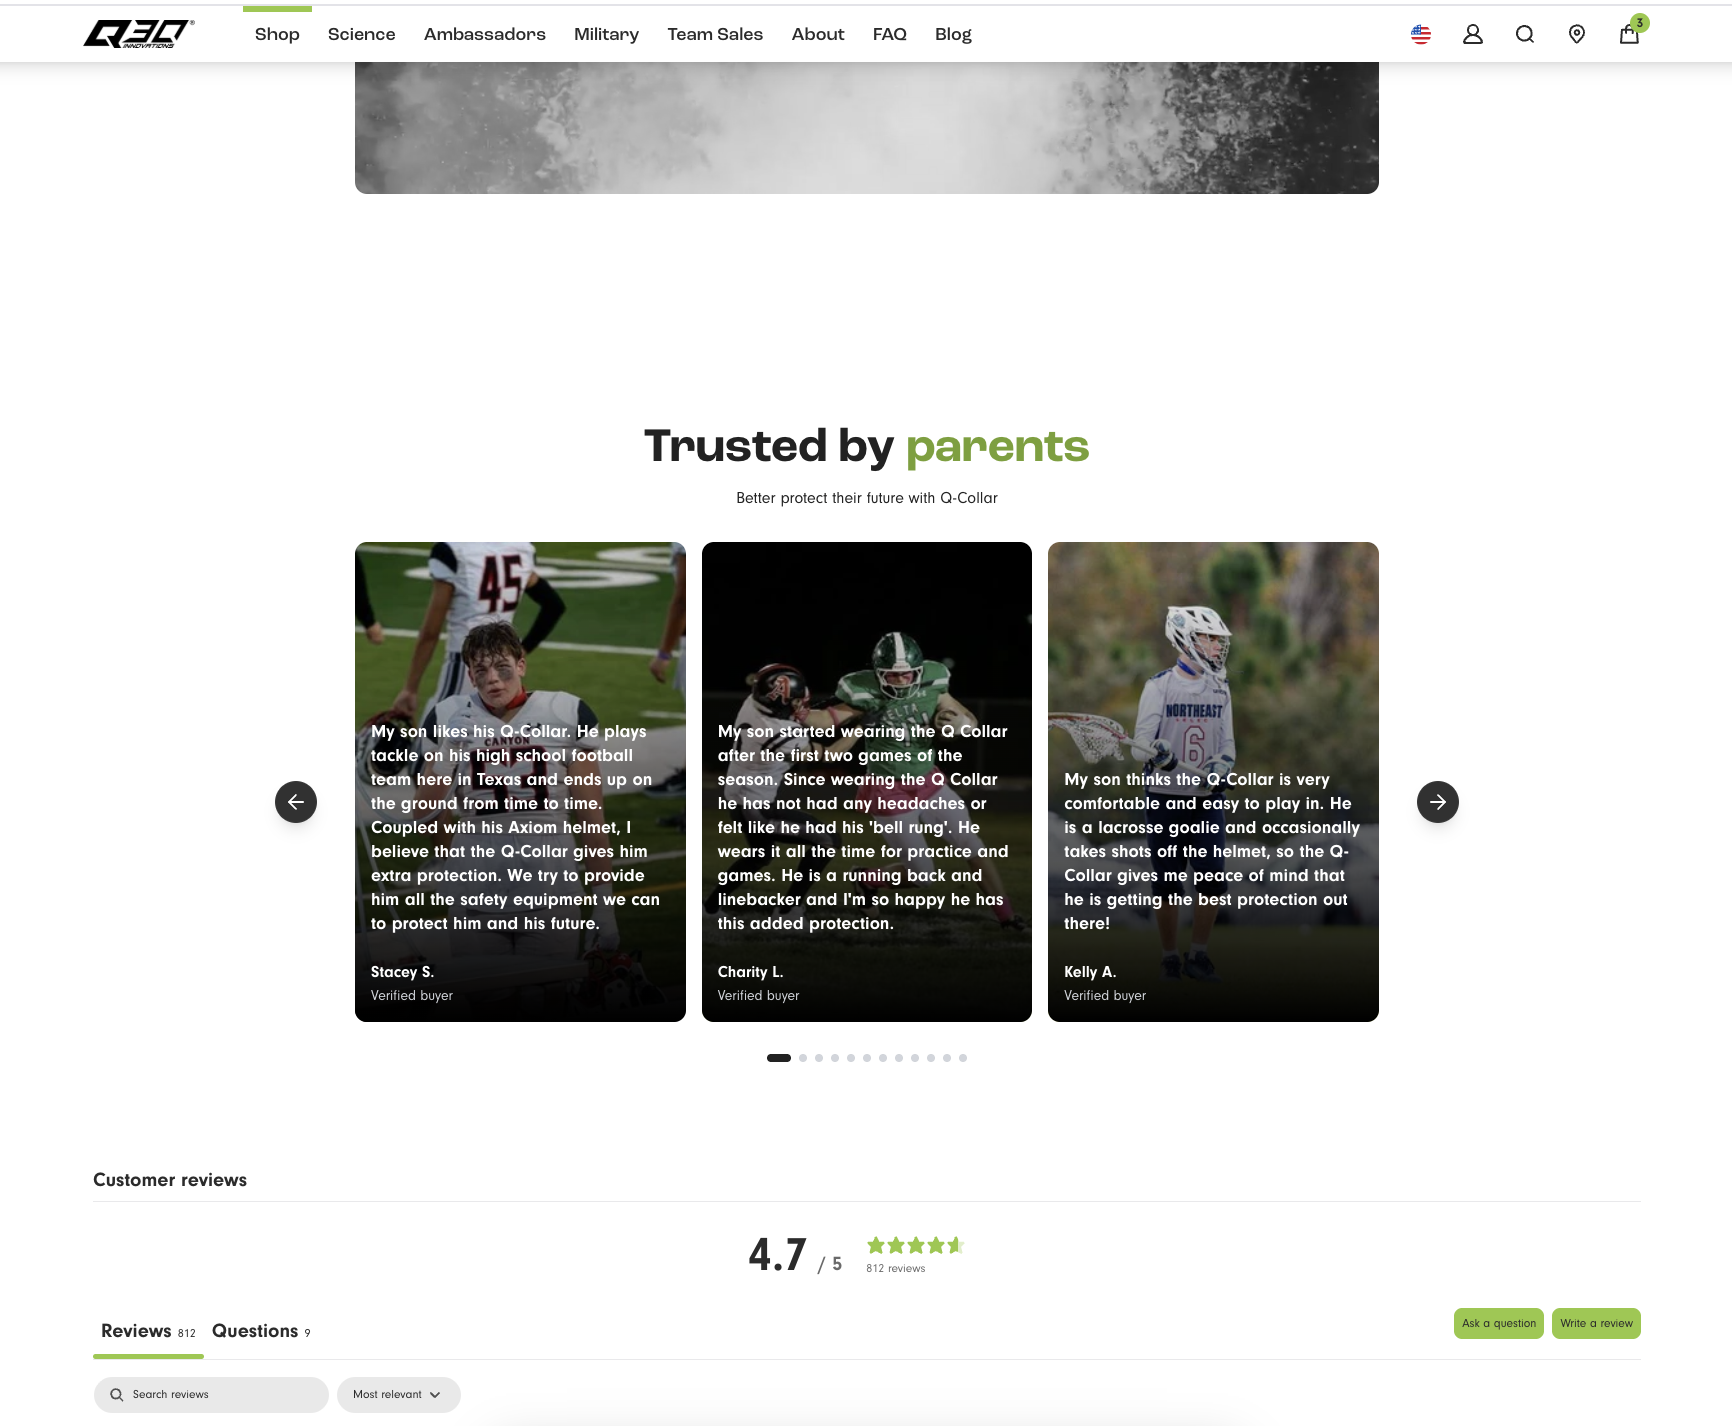
Enhanced Parent and Kid Testimonials Boost Trust
Discover how enhanced user-generated content featuring testimonials increased conversions by 8.5% and reduced bounce rates by 9.4%.
+15.0%
Revenue per visitor (RPV)
Website footer and header redesign
Discover how a redesigned footer navigation led to a +12% click-through rate, enhancing user experience.
-16.3%
Conversion rate
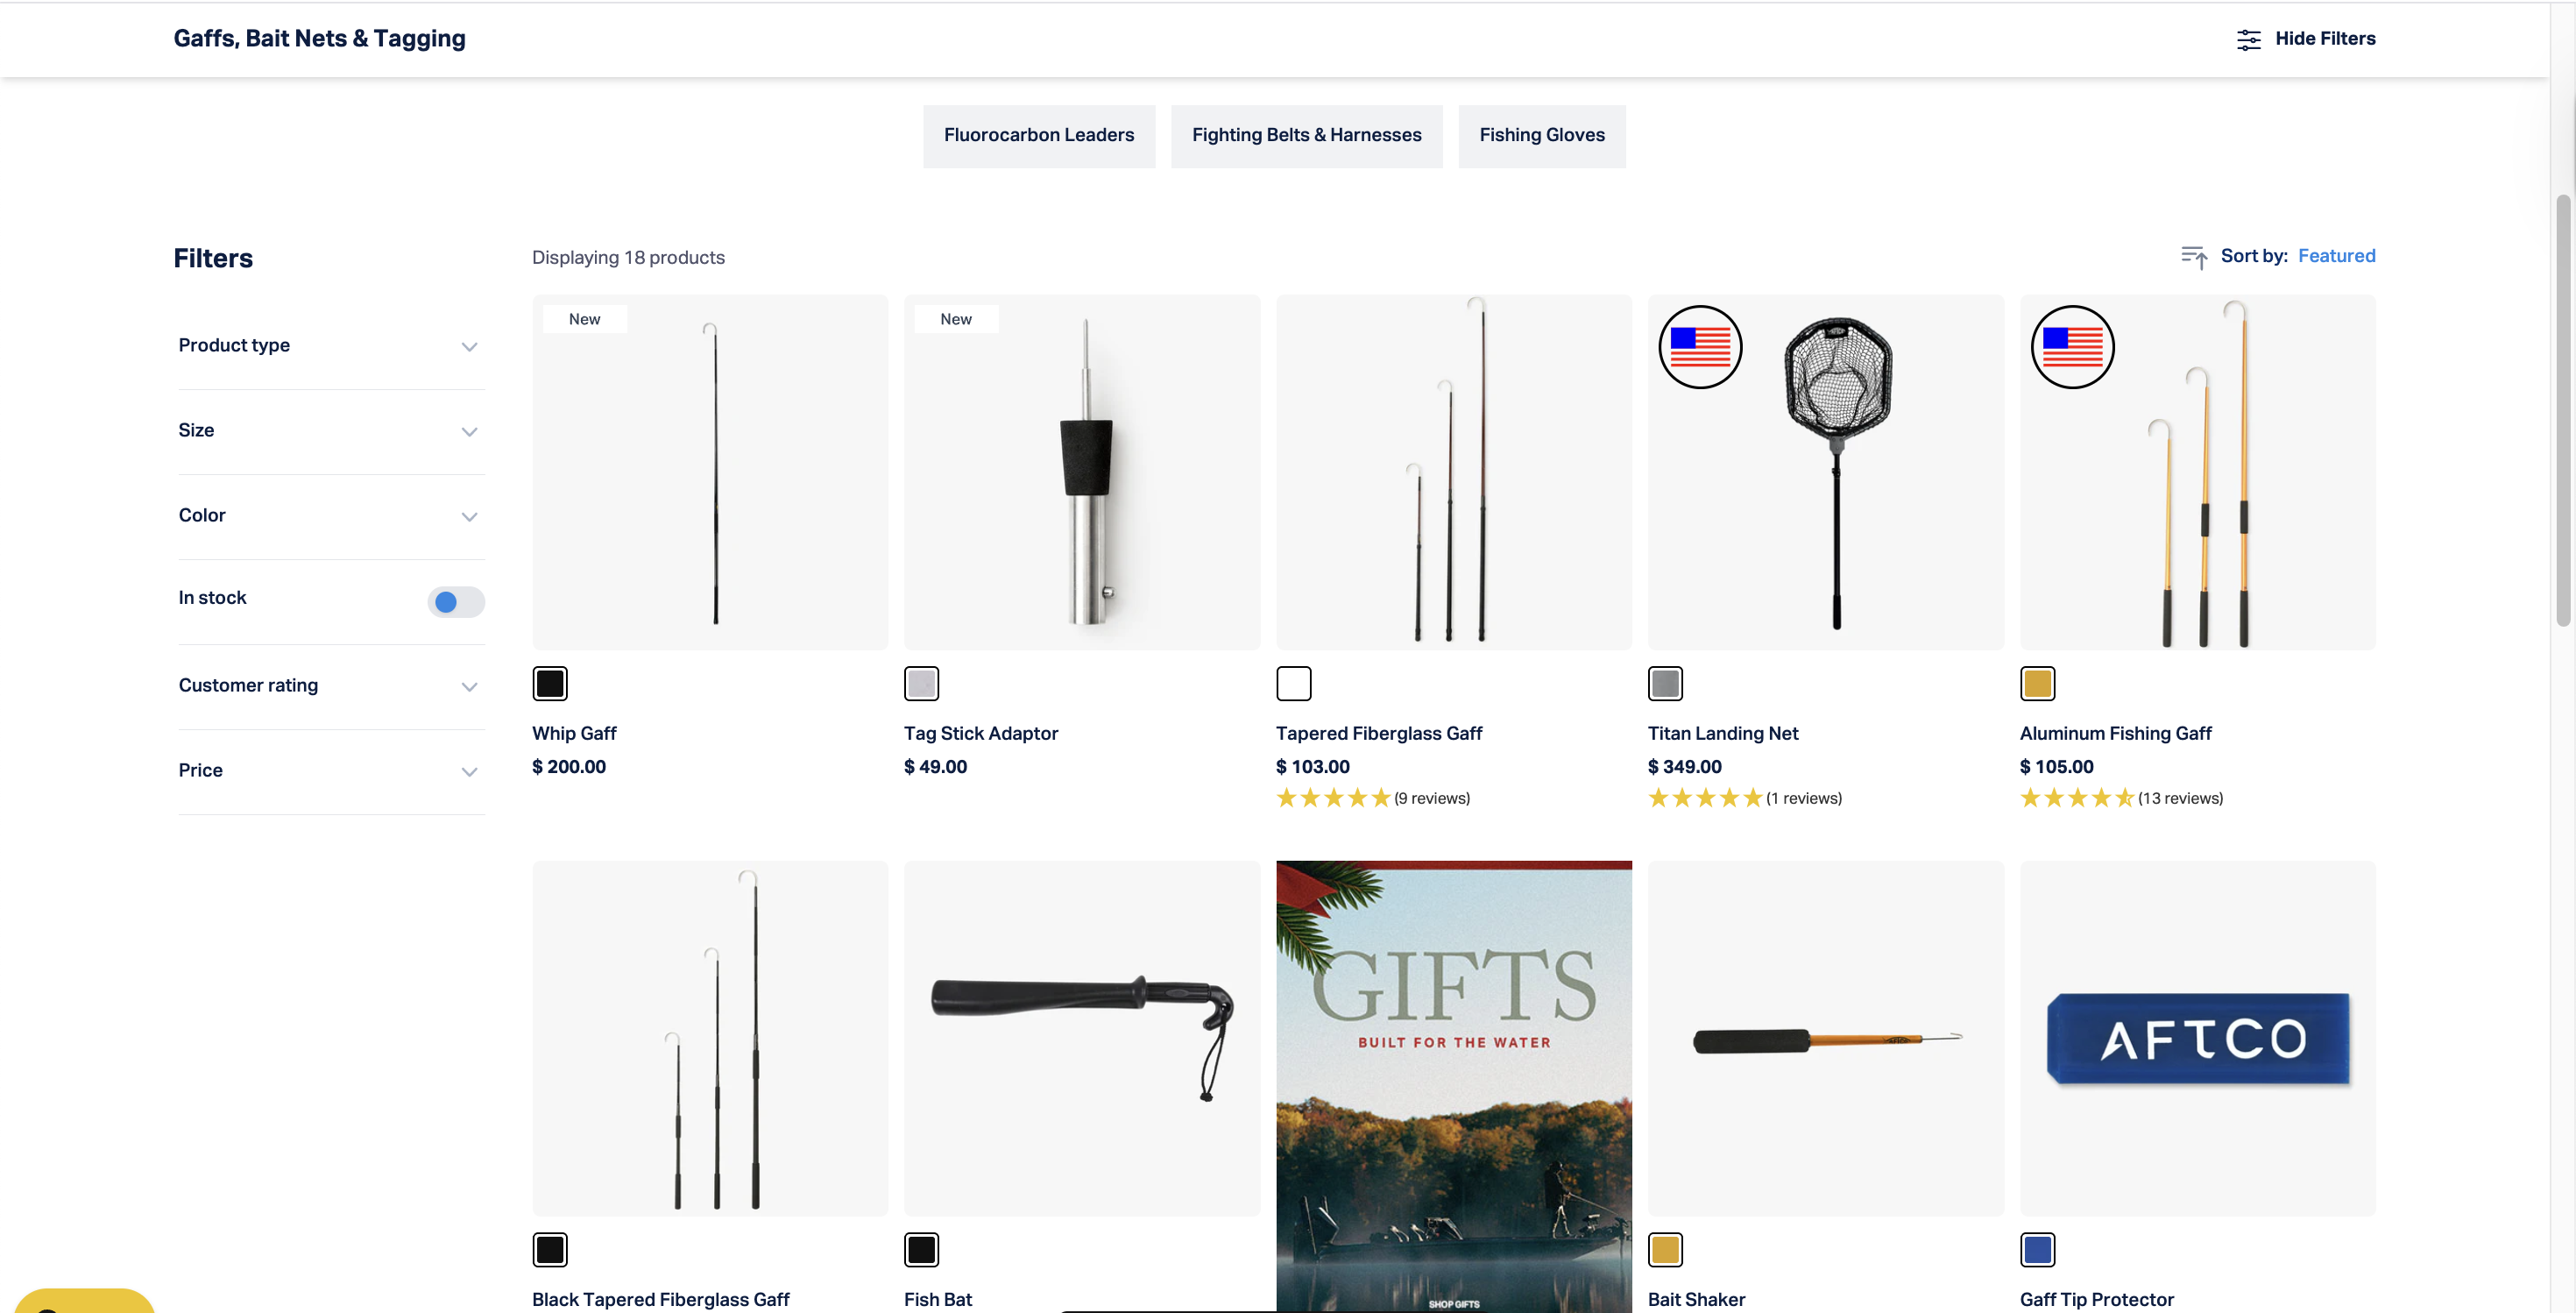
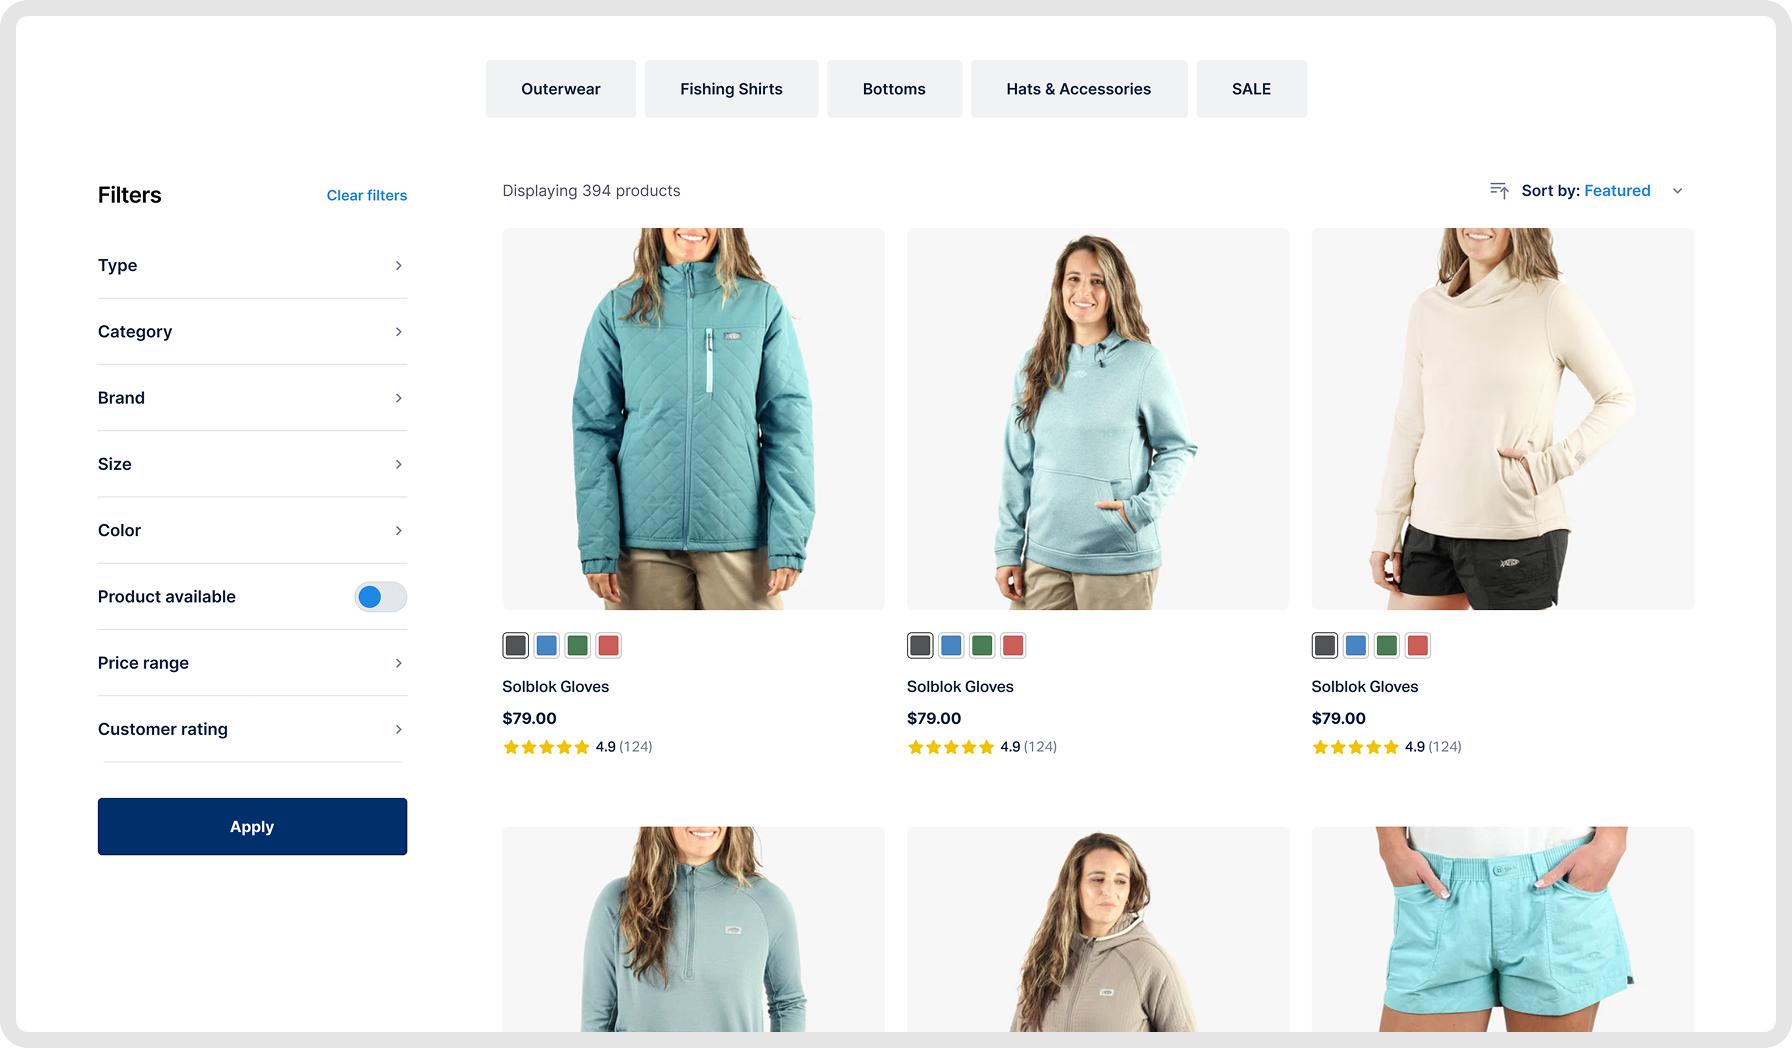
Dynamic filtering system
Discover how a dynamic filter system transformed user experience and achieved a +10.1% increase in conversion rates. Explore the full experiment!
+10.1%
Conversion rate
Moving Free Shipping Message Below Add to Cart
Discover how adding a free shipping message influenced conversion rates and customer behavior. Explore the results of this impactful change!
-0.2%
Conversion rate
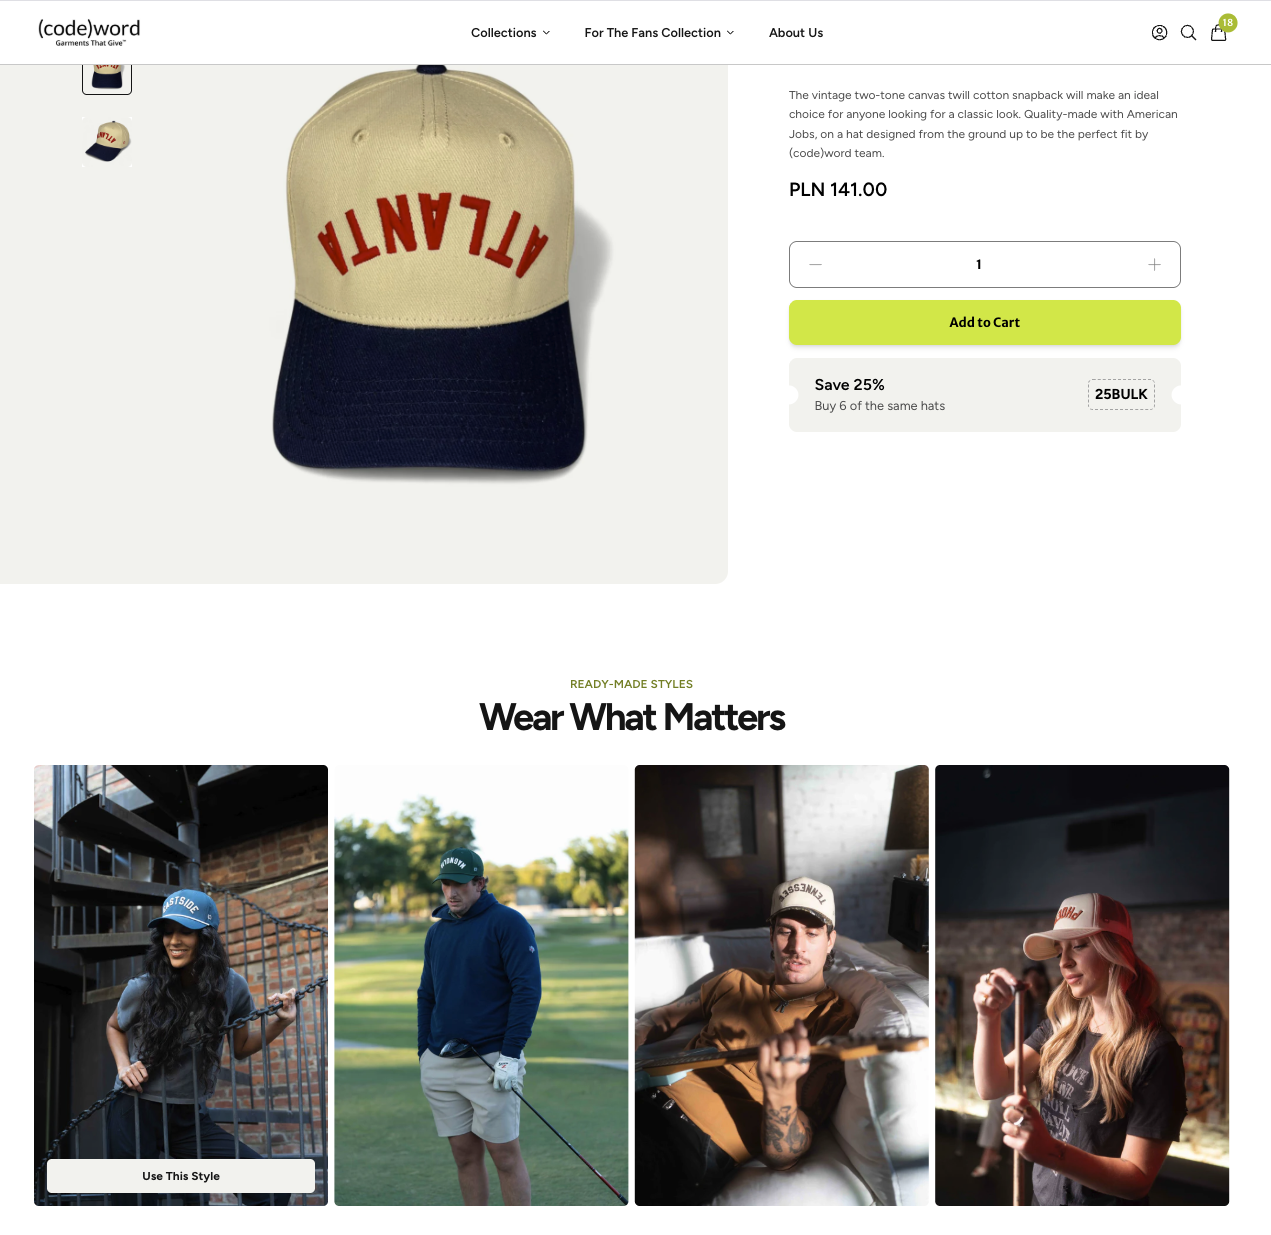
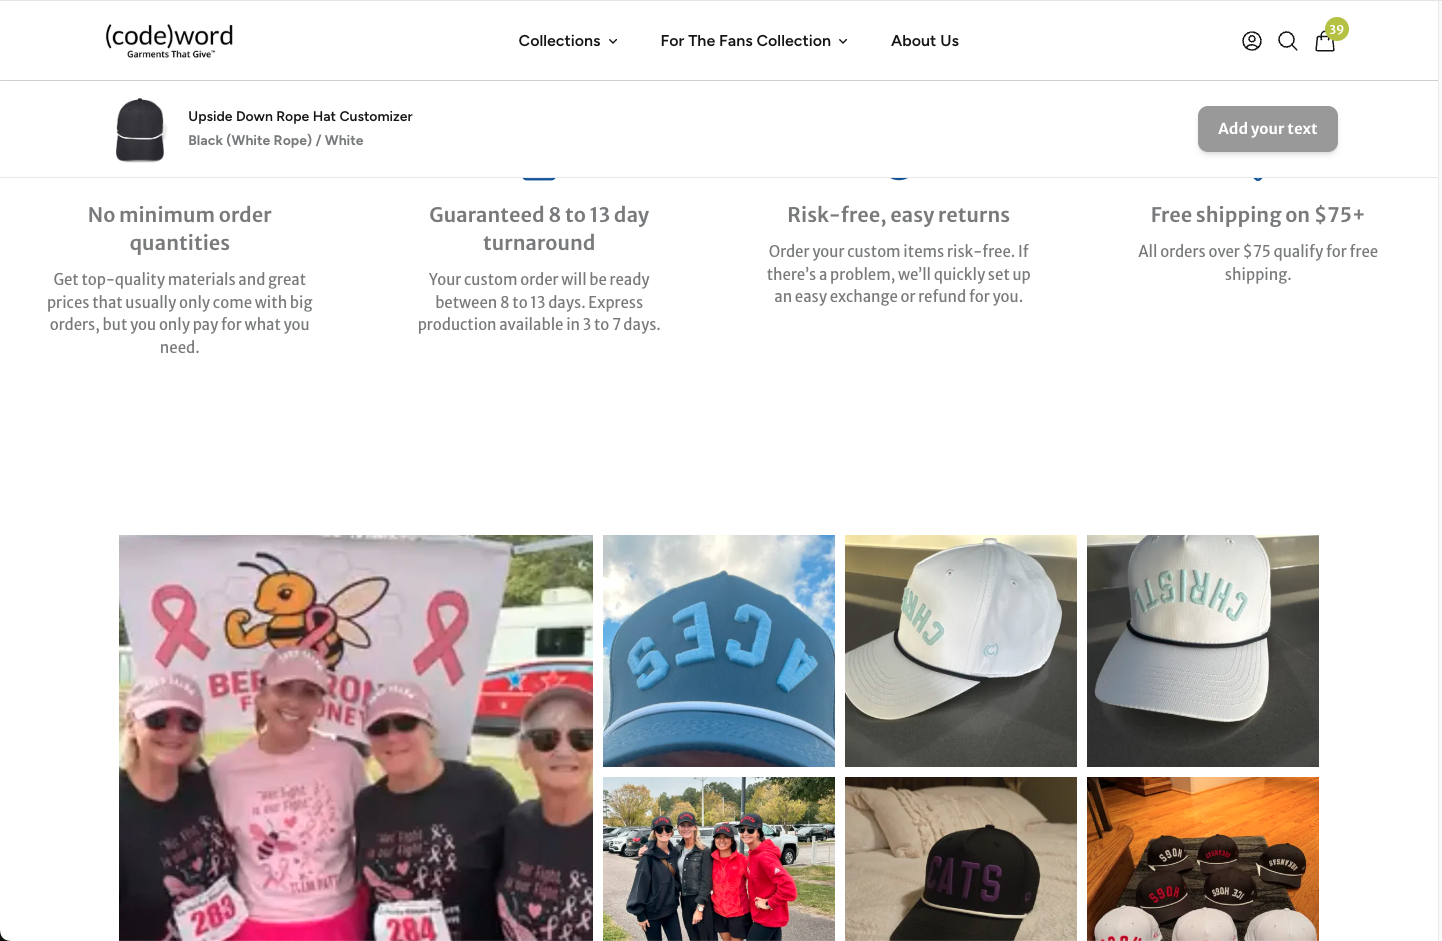
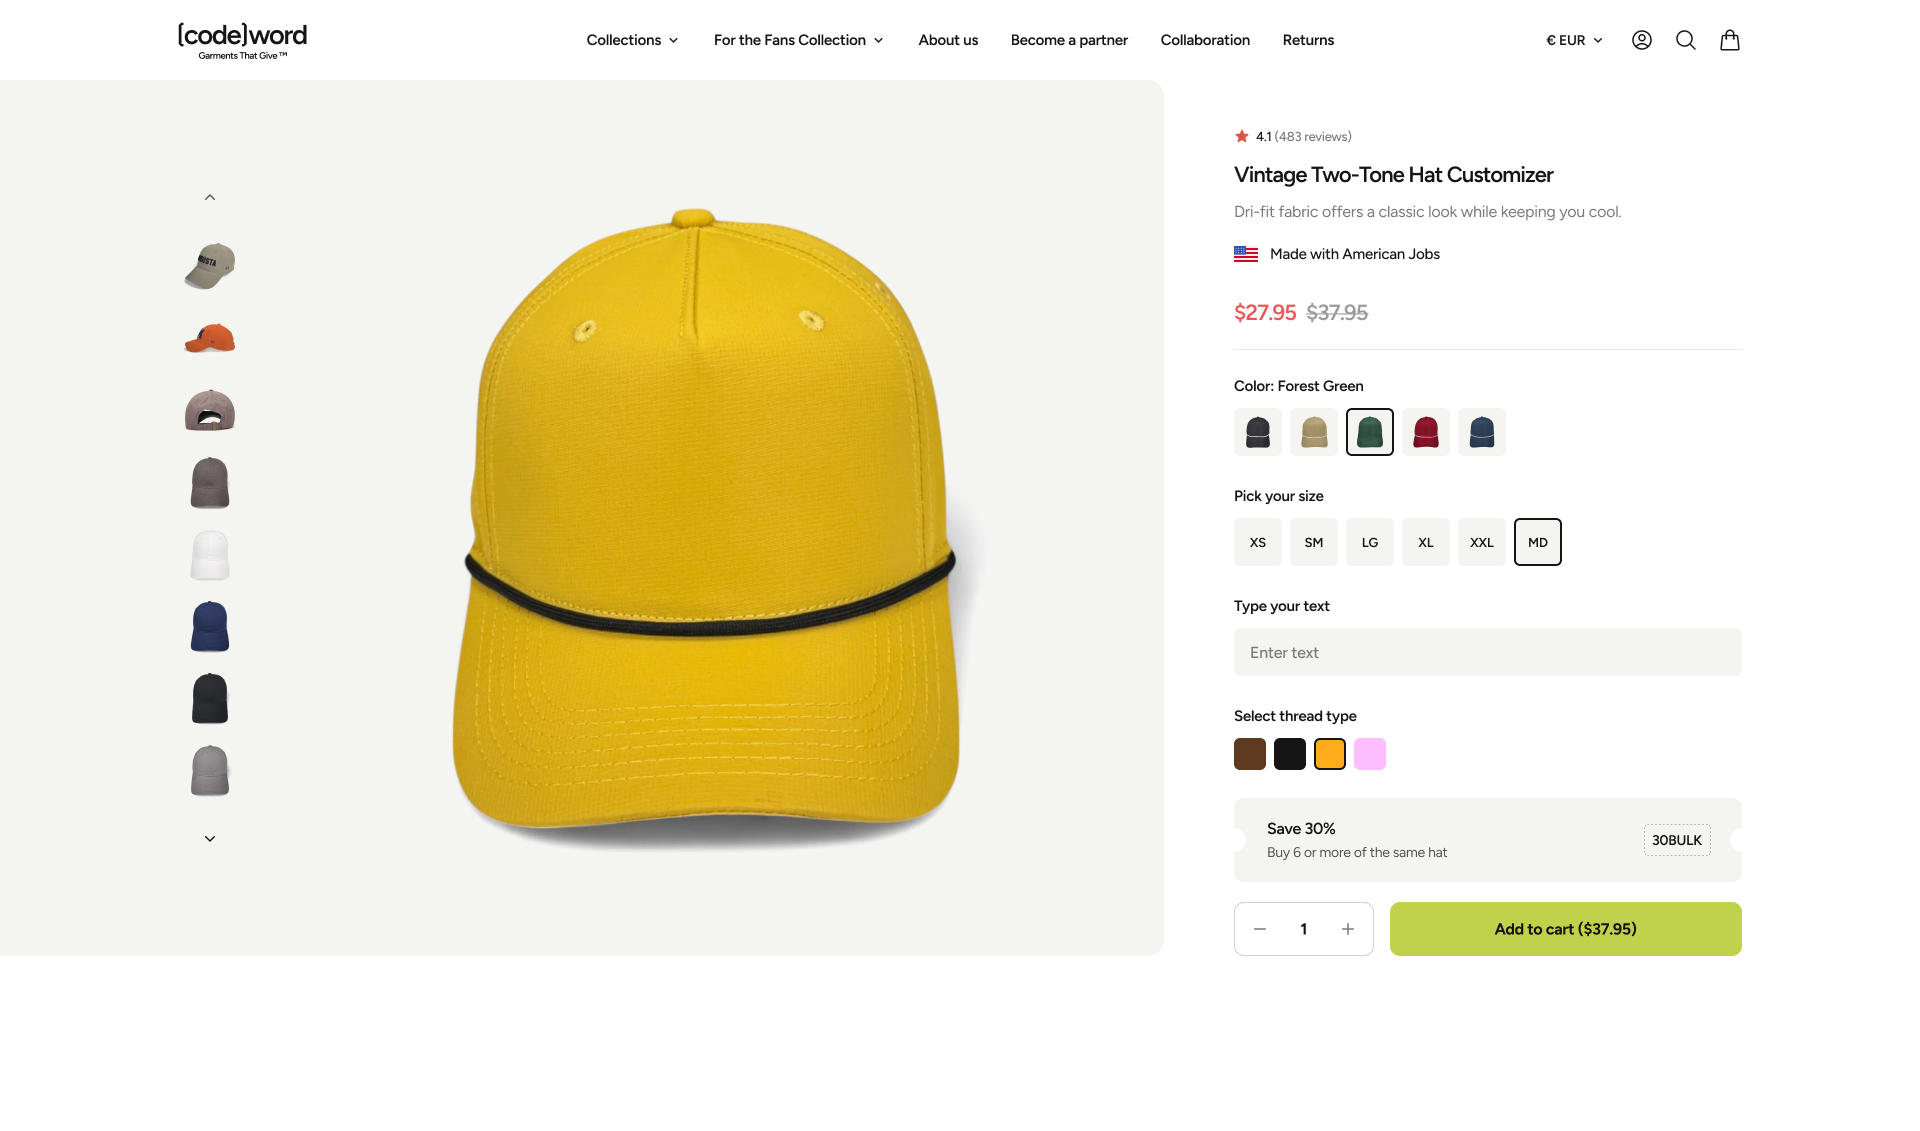
Inspiration Gallery on Custom PDP
Discover how an inspiration gallery on product pages led to a 6.3% lift in conversions, enhancing customer confidence and engagement.
+6.3%
Conversion rate
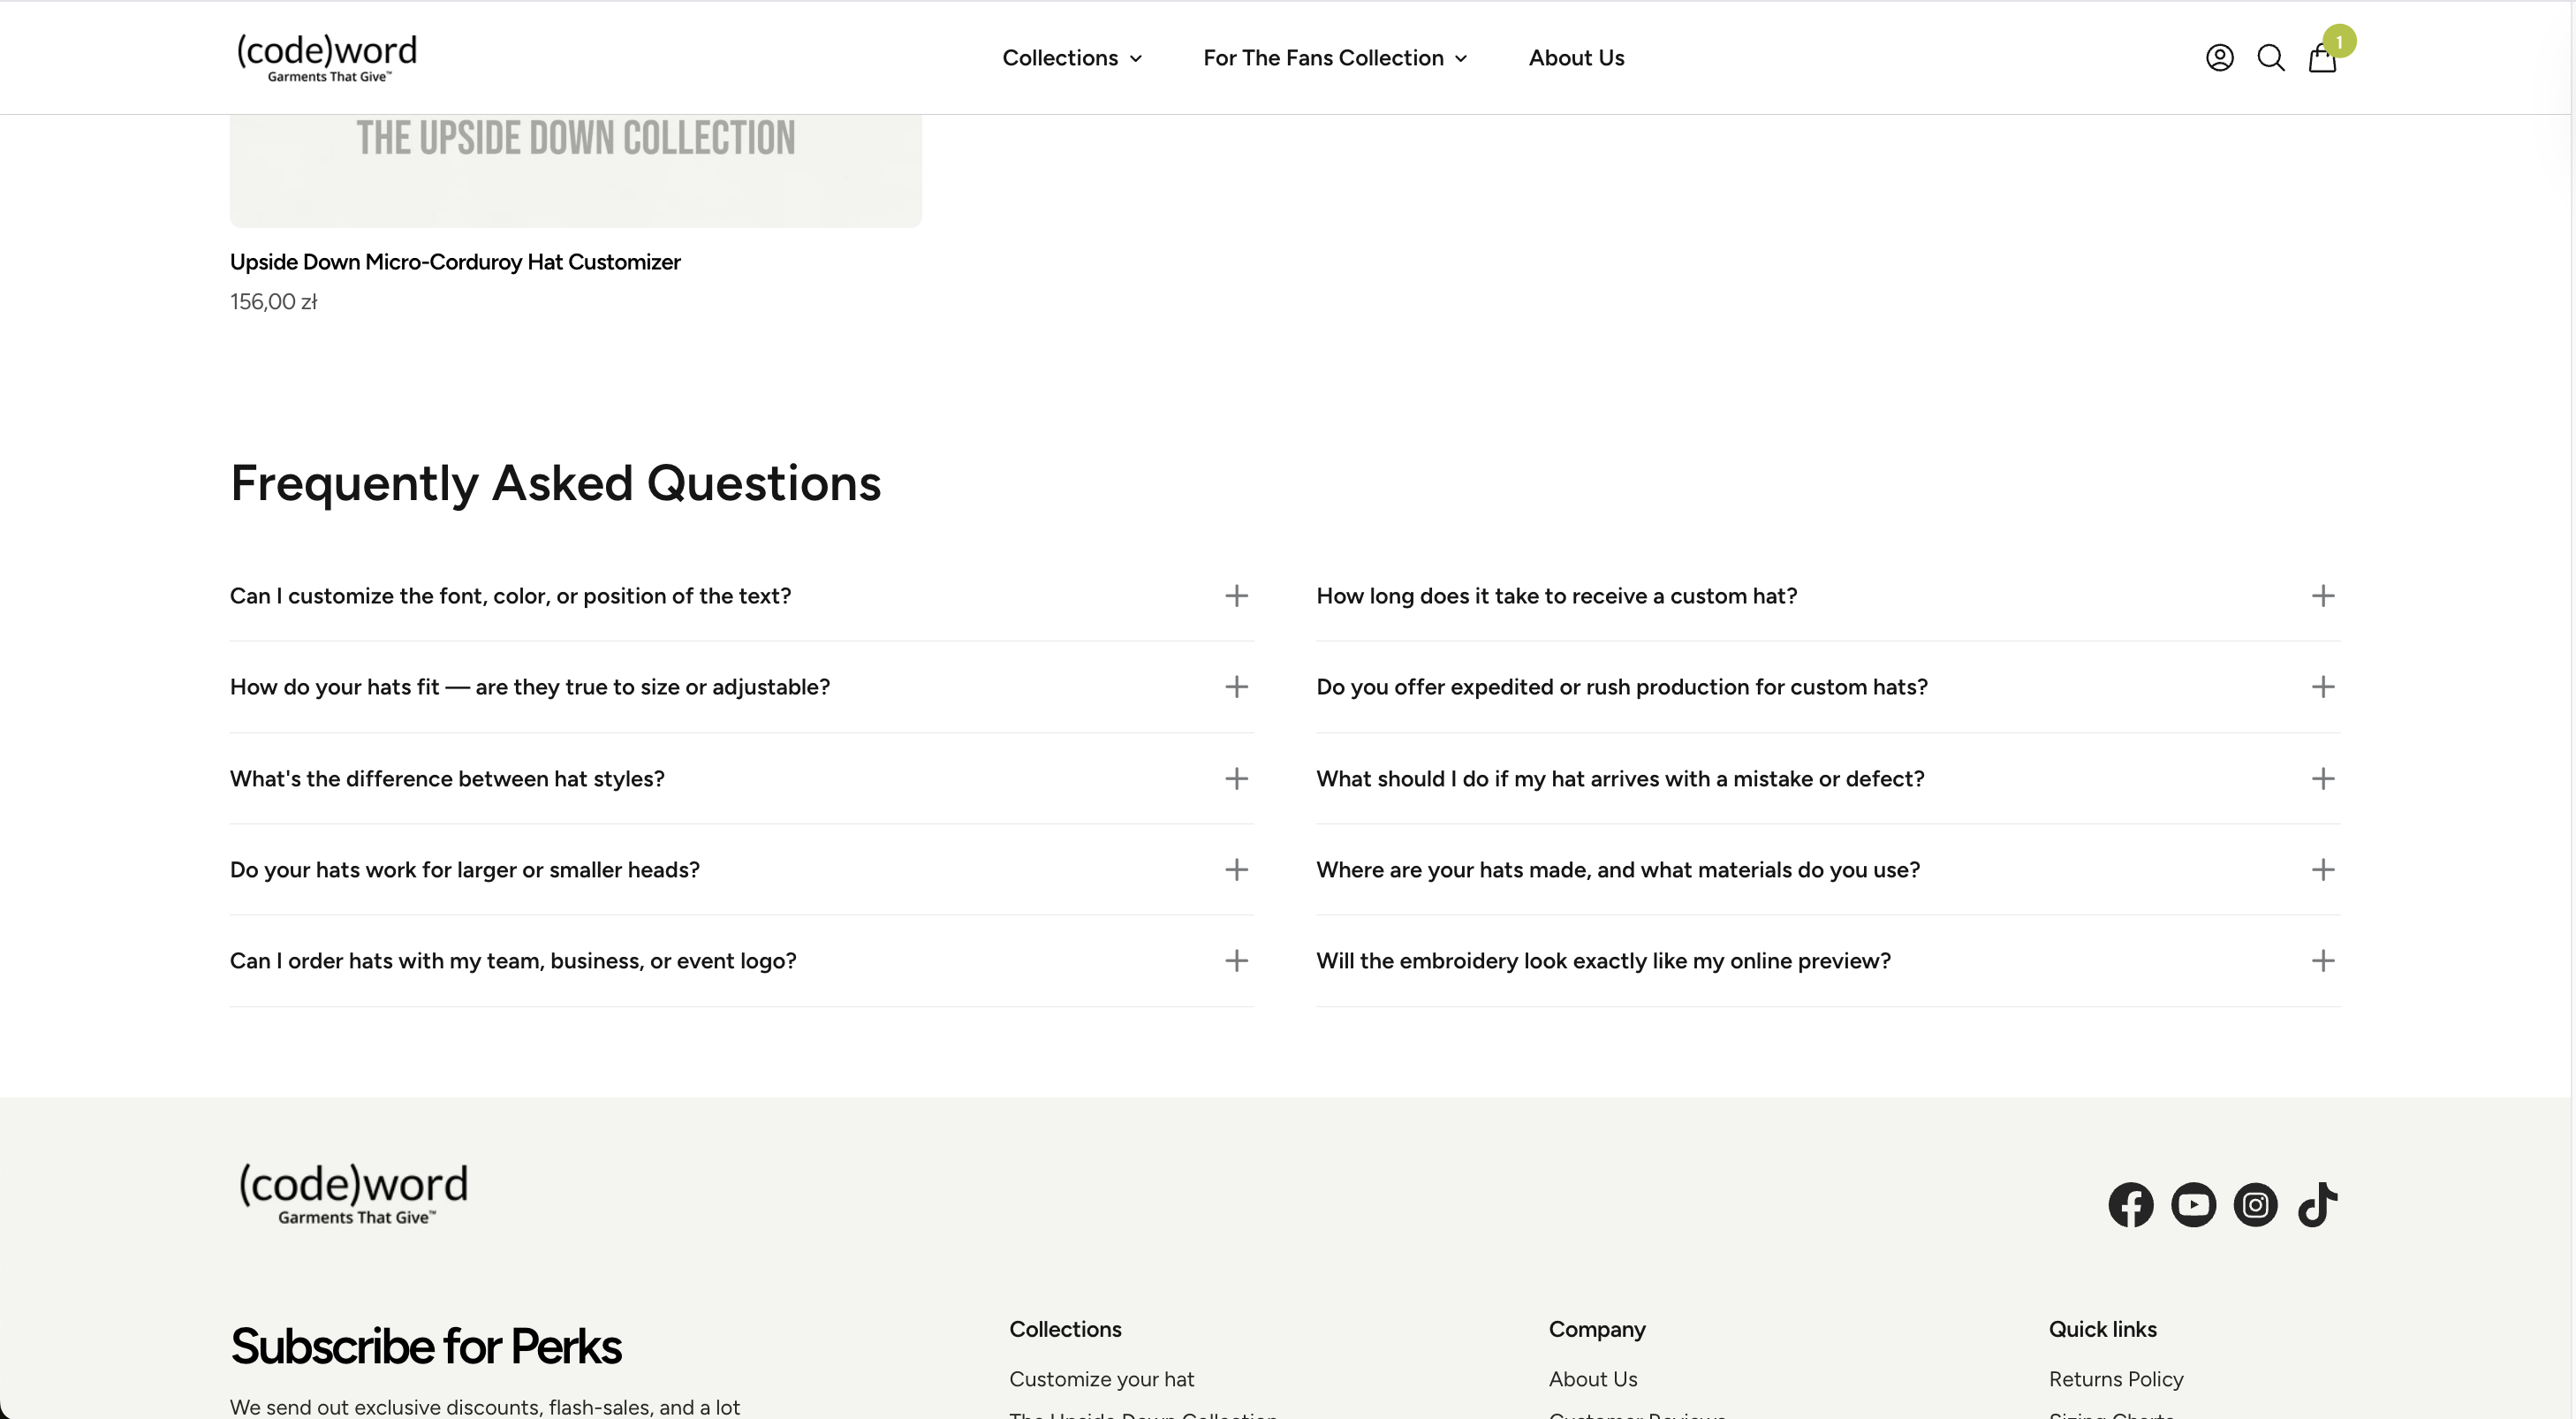
Customer review-inspired FAQs on collection pages
Discover how integrating a curated FAQ module on collection pages led to an 8.4% increase in conversion rates and reduced bounce rates by 33.7%.
+8.4%
Conversion rate
Display Product Badges on Main Image
Discover how adding product badges to main images influenced click-through rates and user engagement, despite mixed conversion outcomes.
-0.5%
Conversion rate
Adding Return Policy Link on Product Pages
Discover how adding a return policy link on product pages influenced mobile conversions, user engagement, and bounce rates in this insightful experiment.
-1.4%
Conversion rate
Category Links on Collection Pages
Explore how adding category links on collection pages influenced user engagement, leading to a notable increase in add-to-cart rates.
-0.4%
Conversion rate
Restructured Product Page Accordion Layout
Revamp your product page layout to enhance user experience! Explore how a new design led to a 50% conversion increase and improved engagement.
+35.6%
Revenue per visitor (RPV)
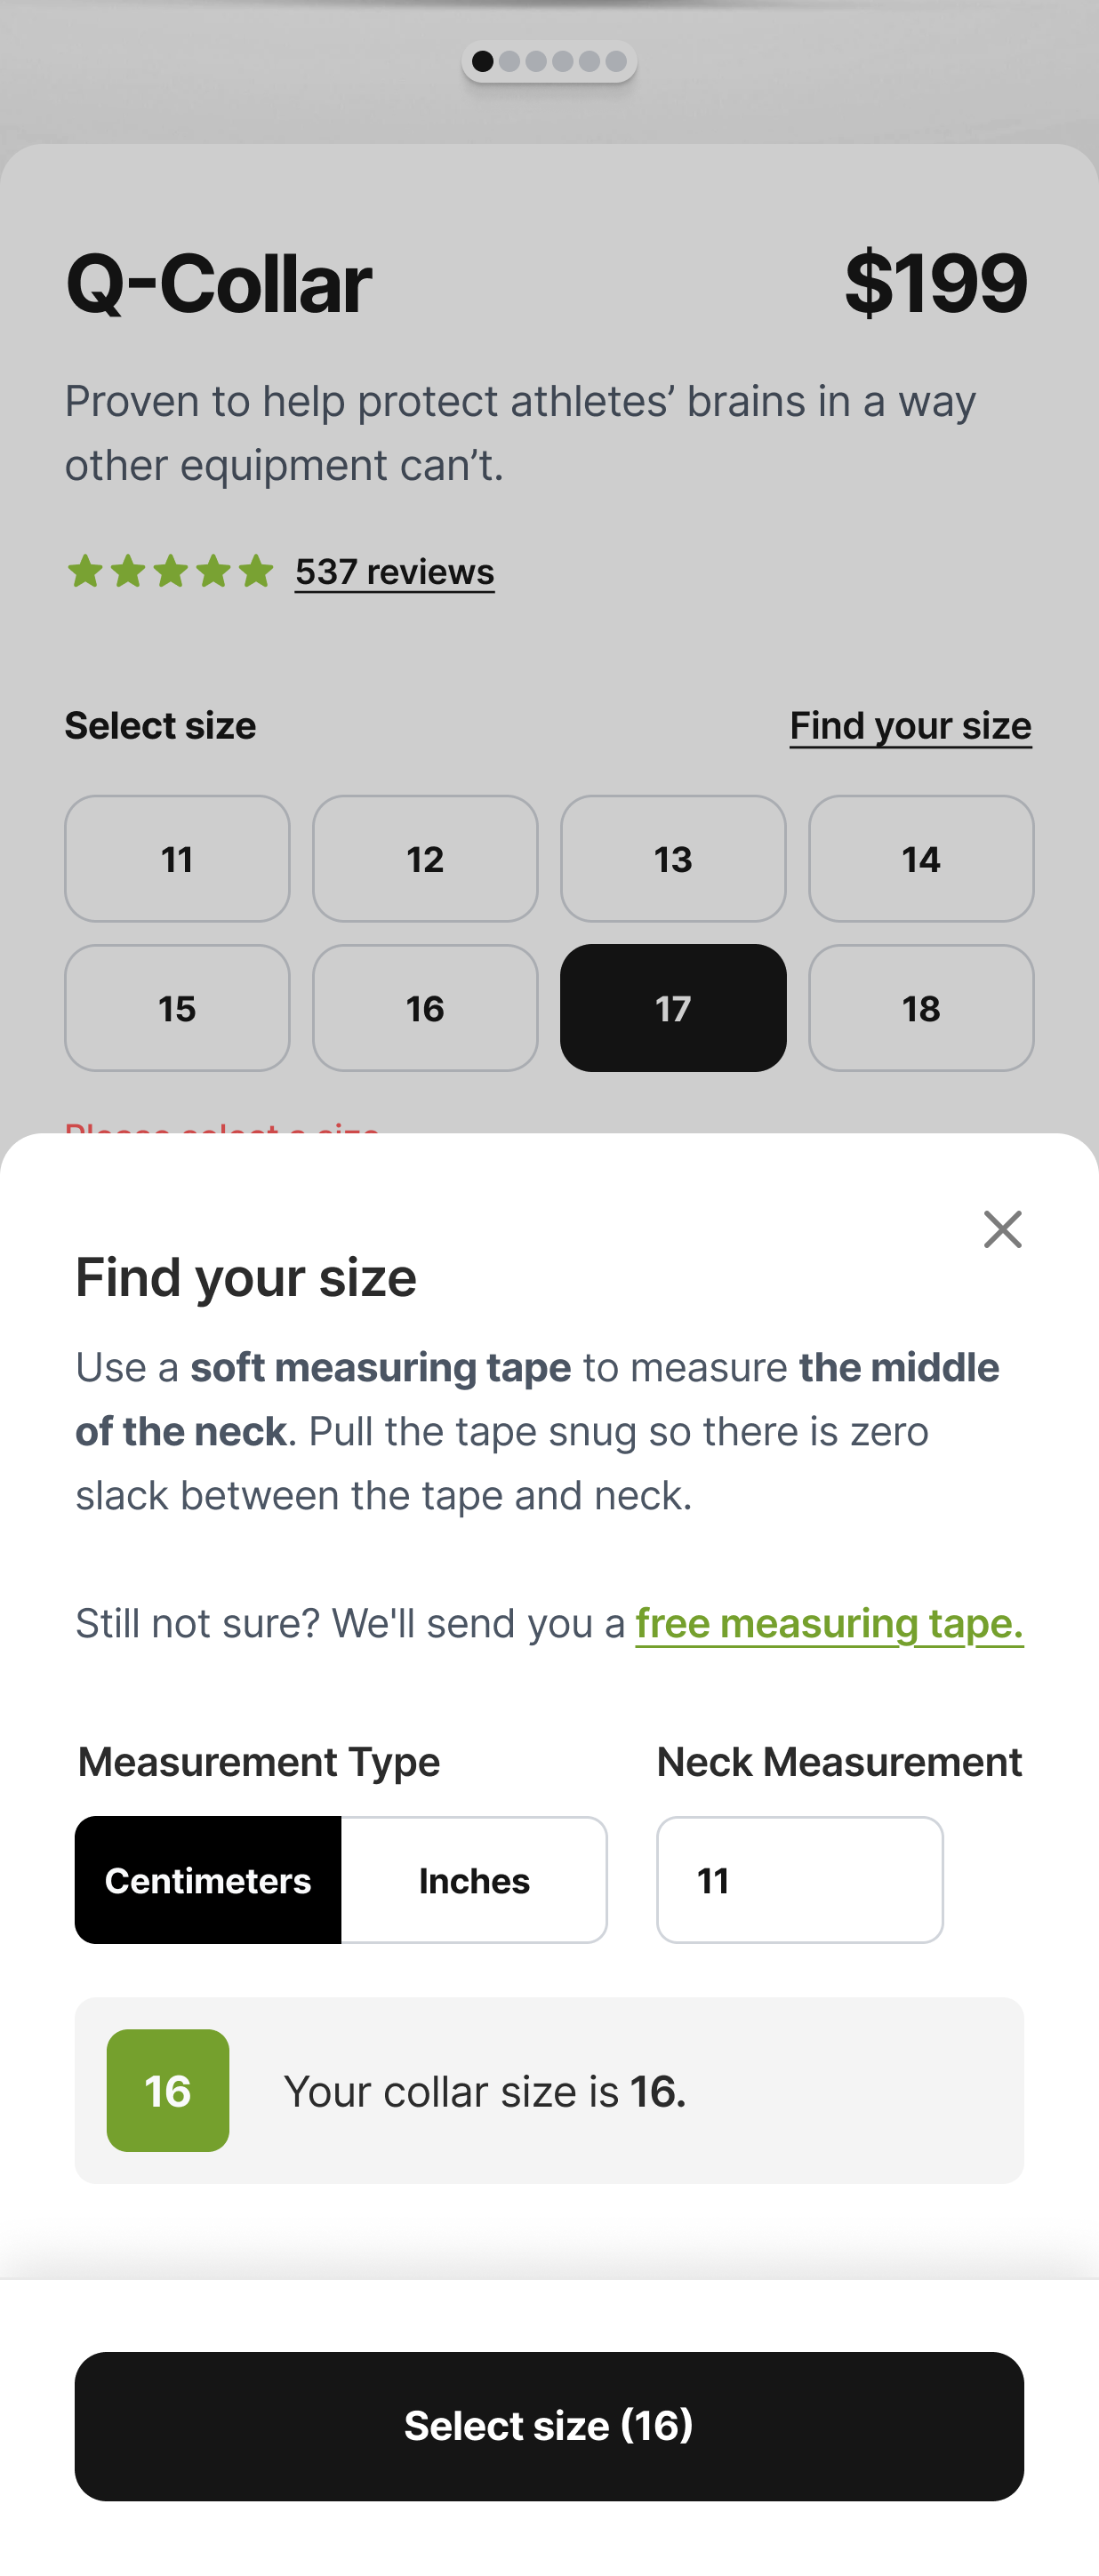
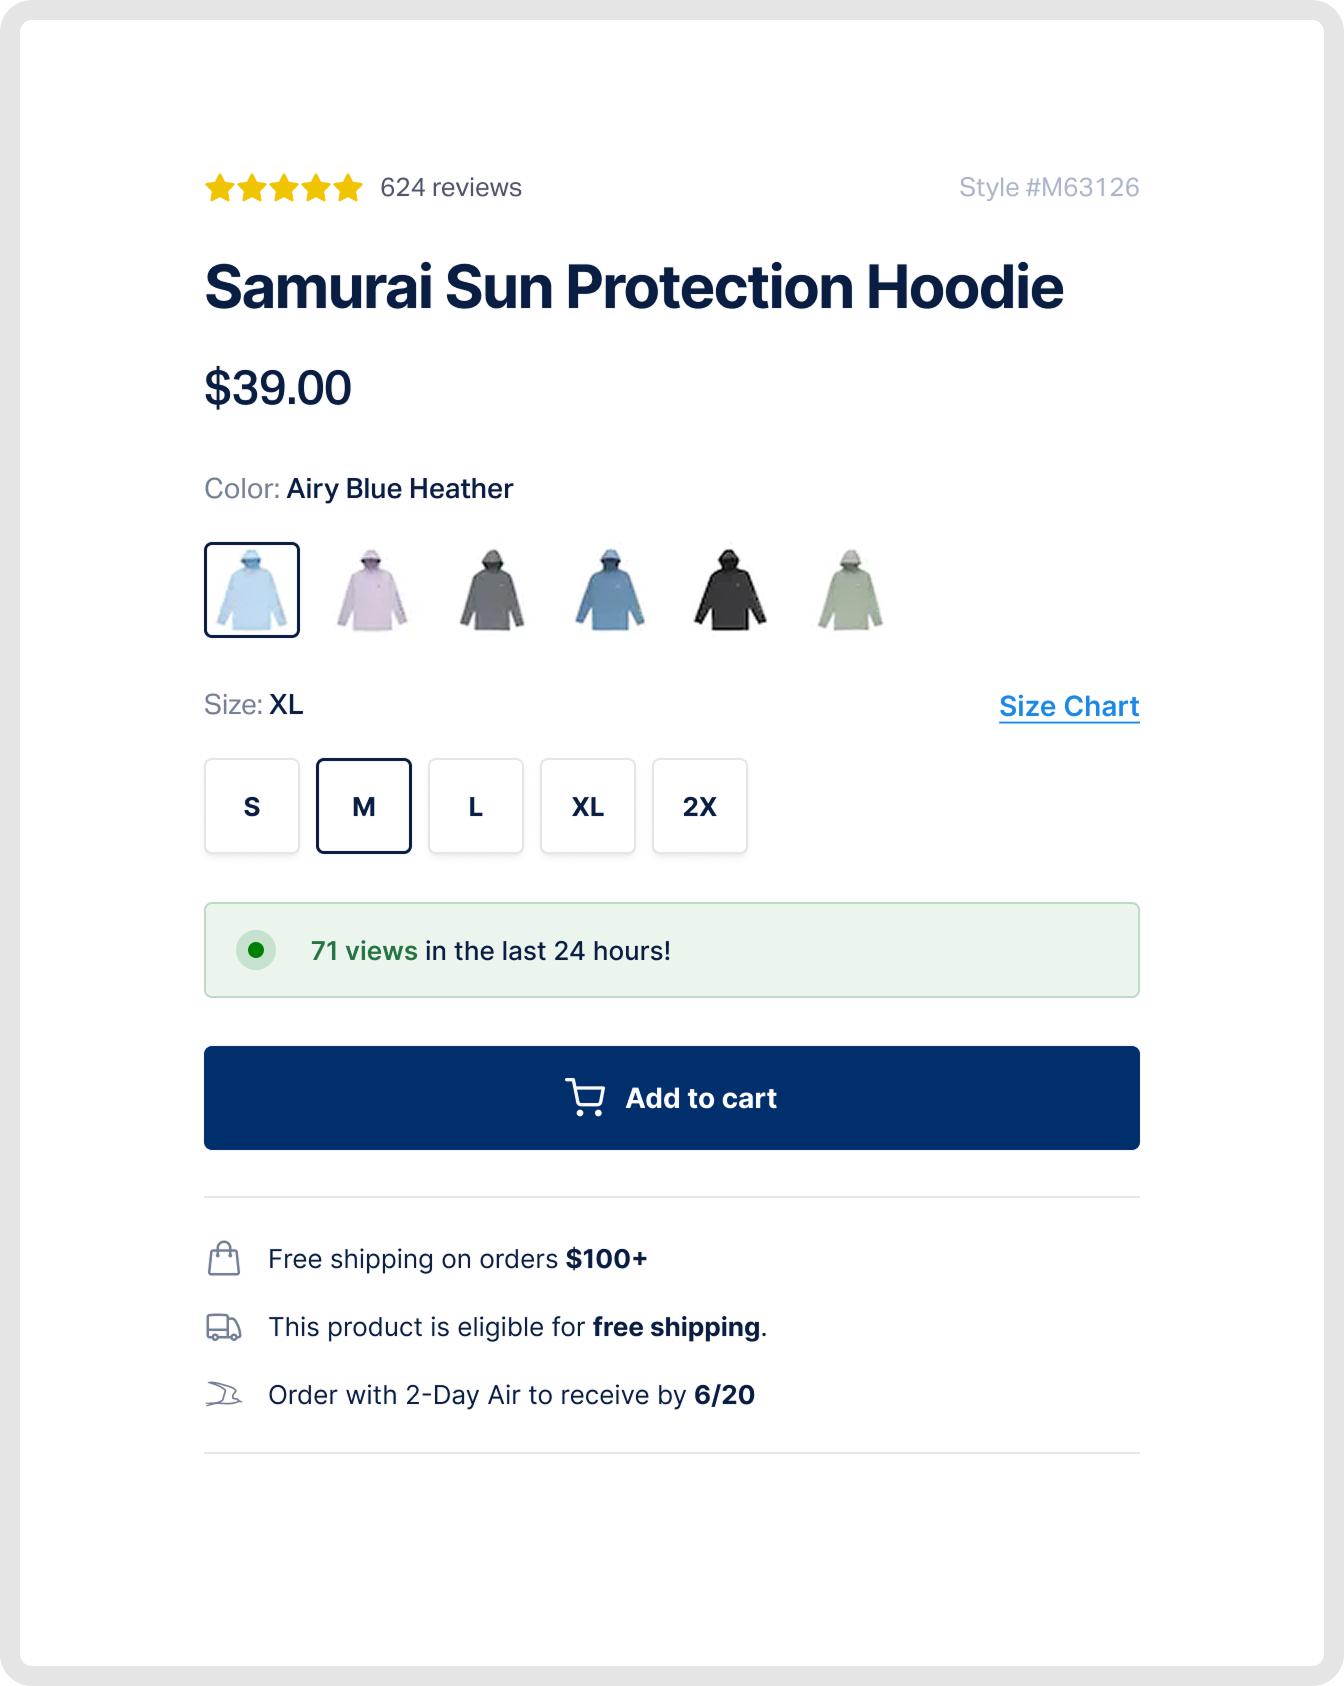
Redesigned “Find Your Size” Feature
Discover how a redesigned "Find Your Size" feature led to a remarkable 33.1% increase in conversions and enhanced user engagement.
+14.9%
Revenue per visitor (RPV)
Personalized Homepage for New vs Returning Visitors
Discover how personalizing homepages for different visitor types led to a remarkable +241.1% conversion rate increase. Explore the insights now!
+621.9%
Revenue per visitor (RPV)
Redesigned Homepage With Extra "Educational" Content
Discover how personalizing the homepage for different visitor types resulted in a 0.5% conversion rate increase and enhanced user engagement.
+3.1%
Revenue per visitor (RPV)
Discover how one experiment led to a 46.6% increase in conversions and a 58.0% rise in orders. Explore innovative strategies today!
-10.4%
Revenue per visitor (RPV)
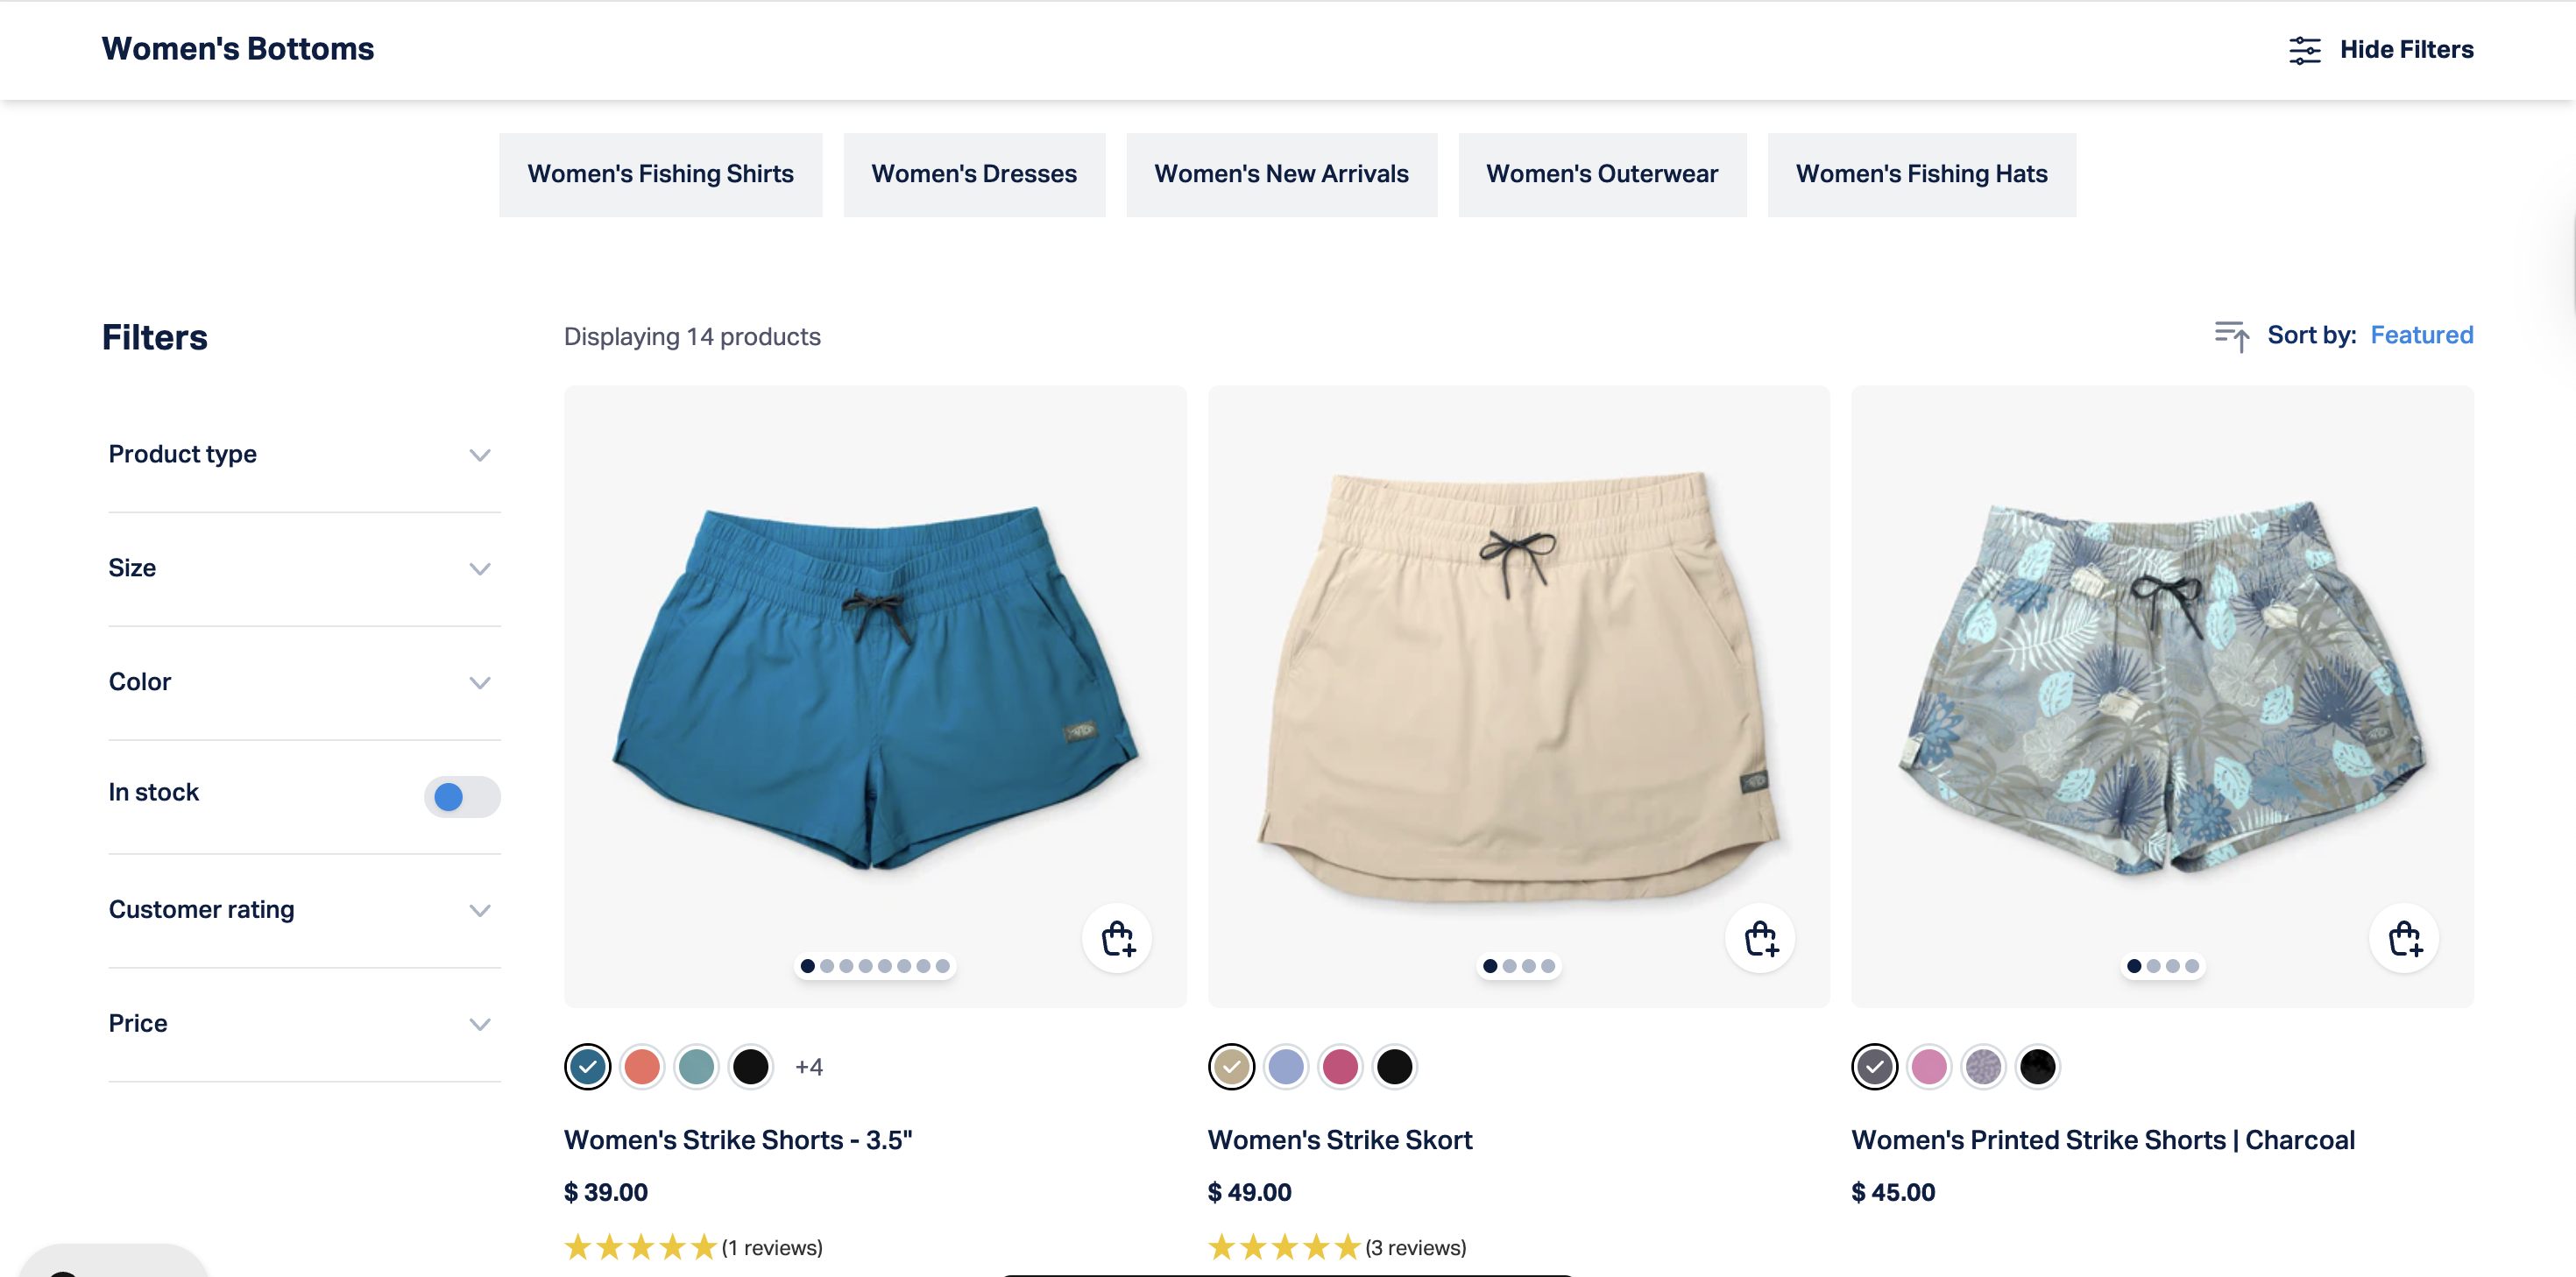
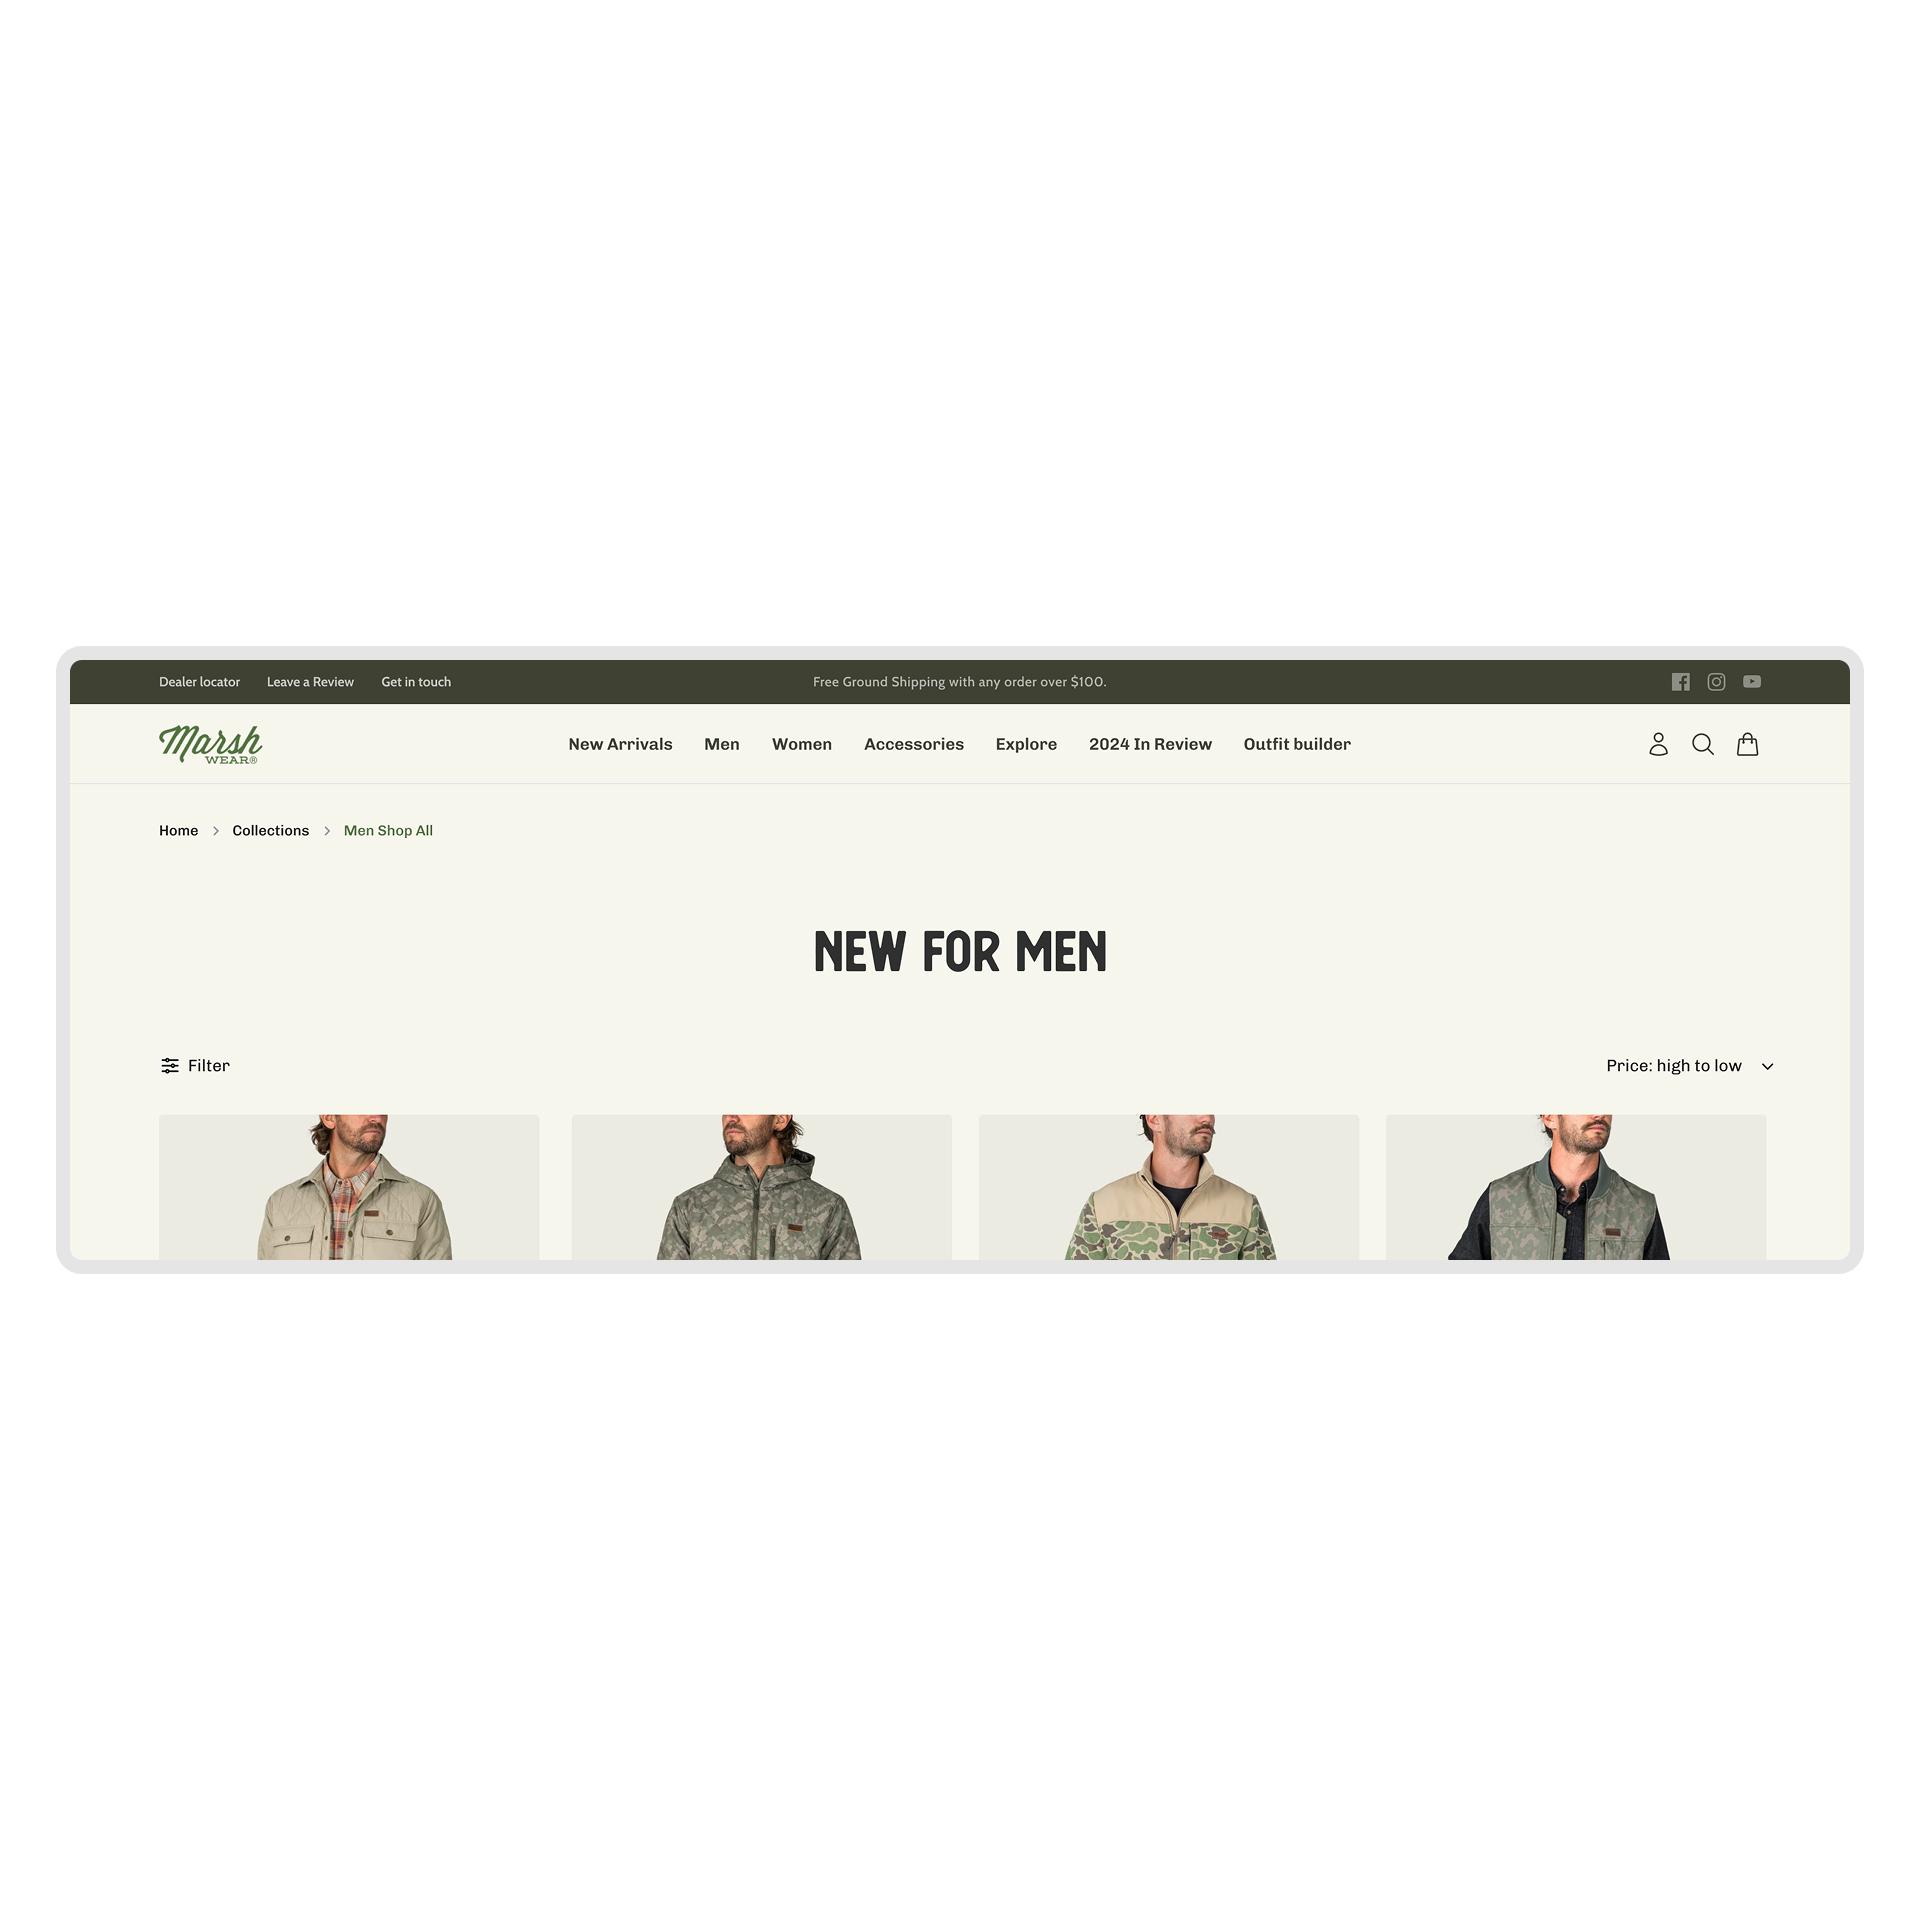
Wider Collection Page
Discover how widening the collection page increased click-through rates by 4.0% while reducing bounce rates by 11.8%. Explore the insights!
+4.0%
Clickthrough rate
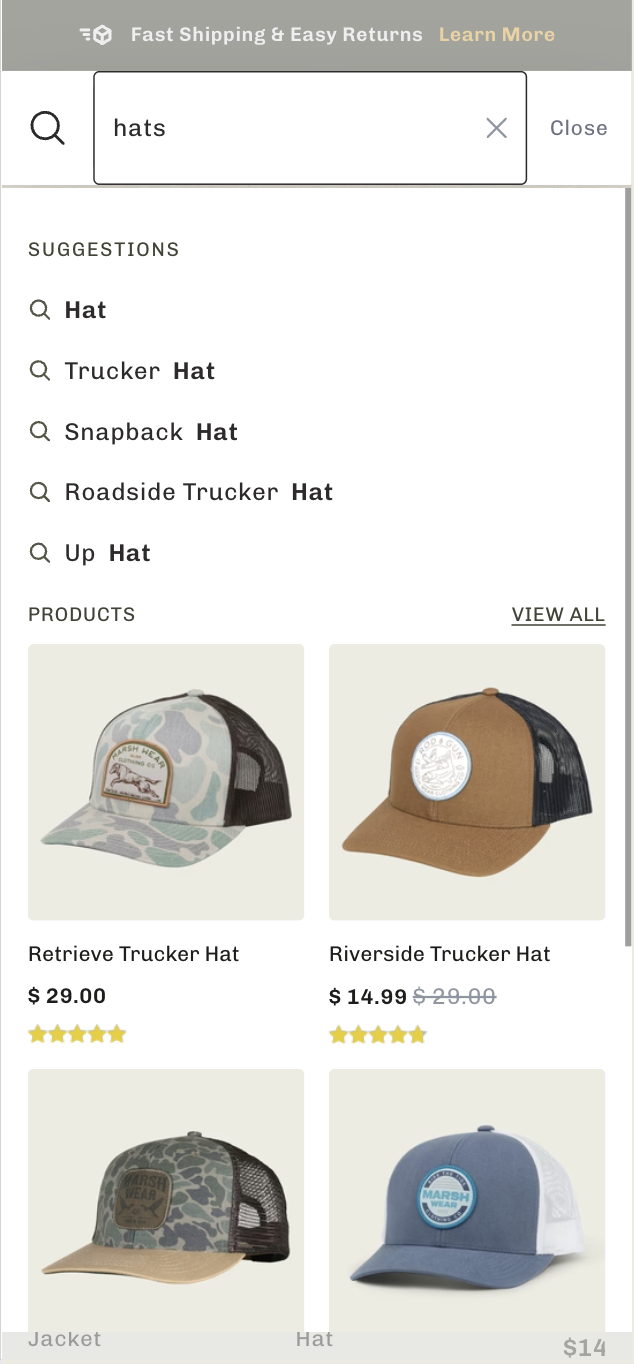
Enhanced search results with clickable categories increase user engagement and conversions
Revamped search functionality led to a 13.7% rise in conversions. Discover how enhanced product discovery can transform user experience!
+1.2%
Clickthrough rate
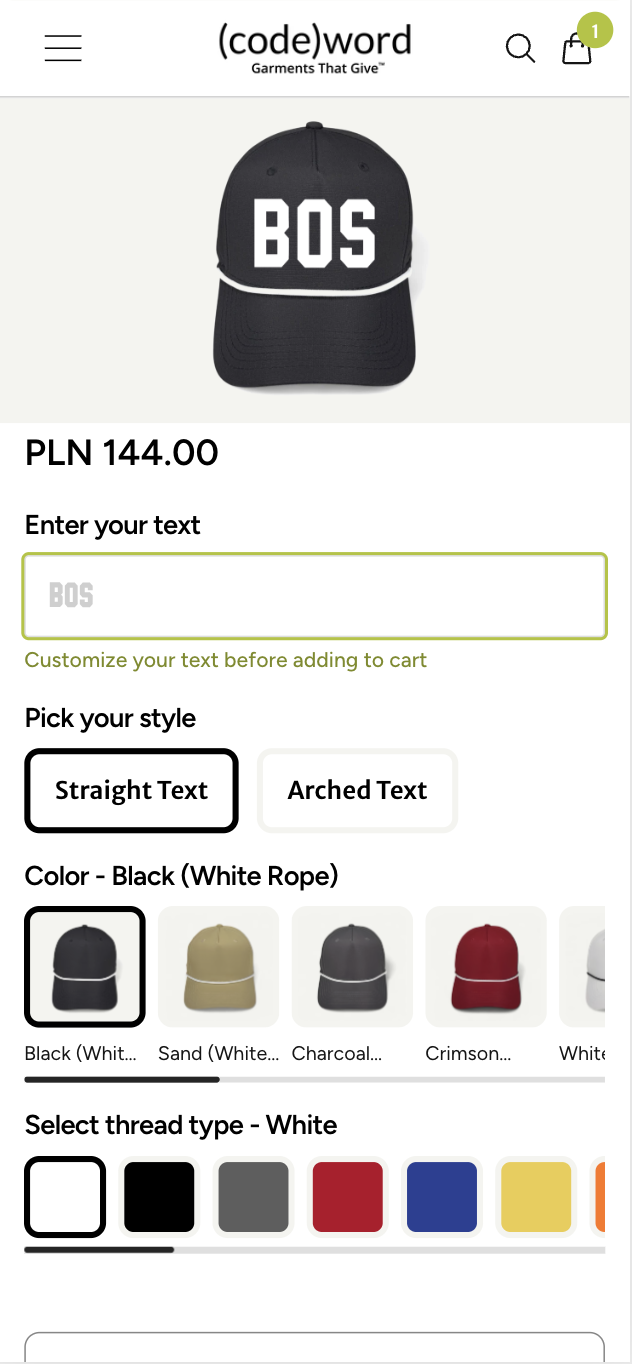
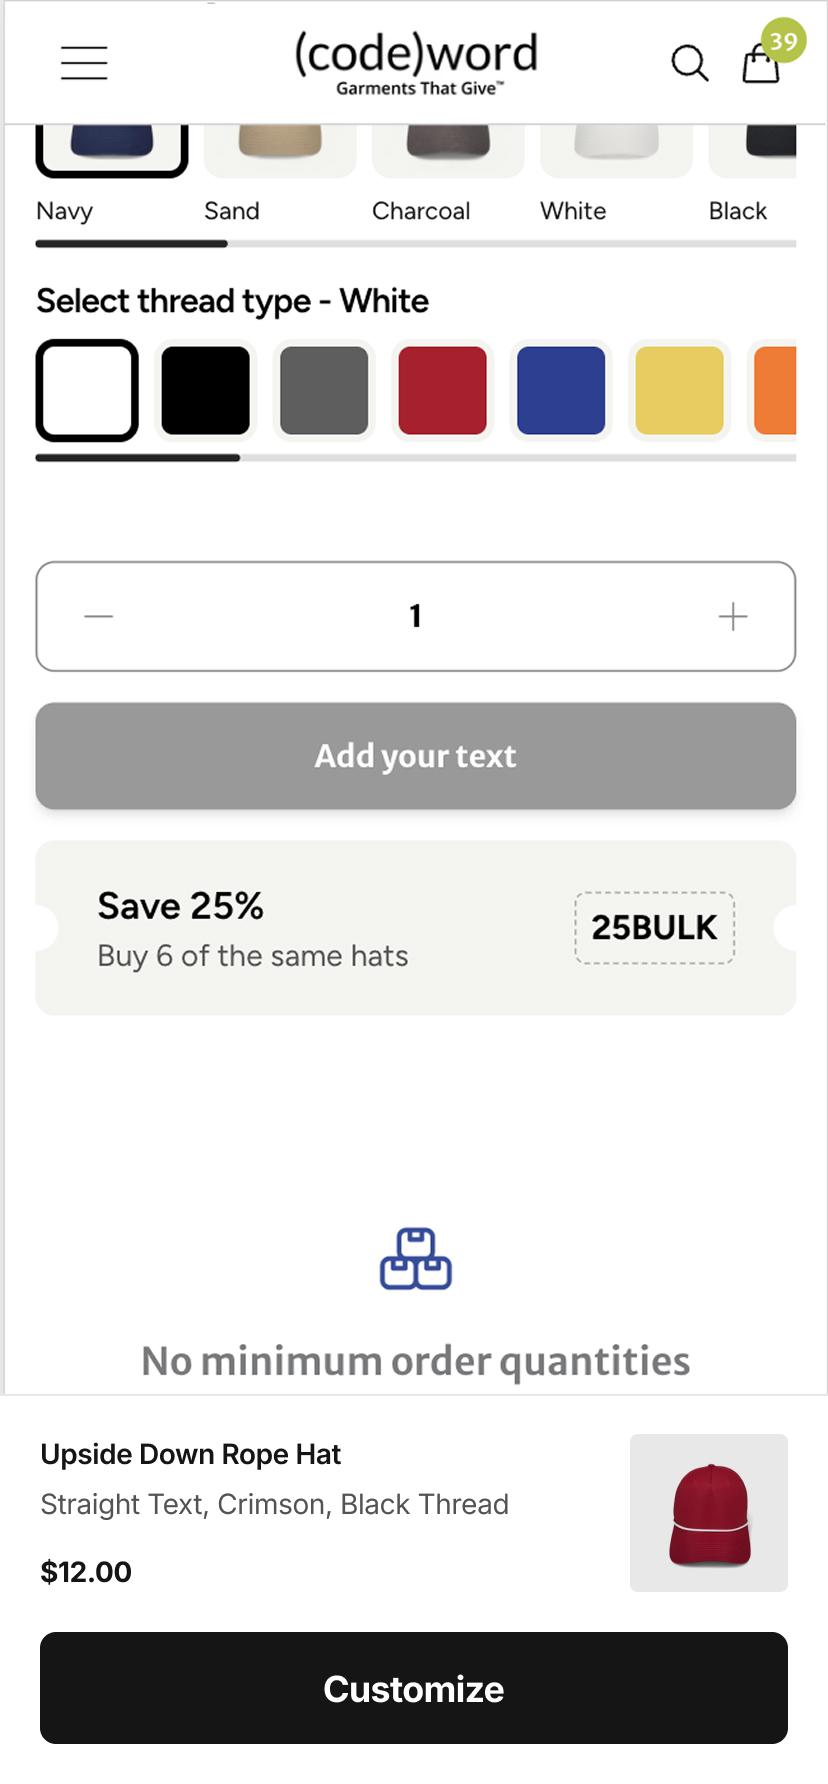
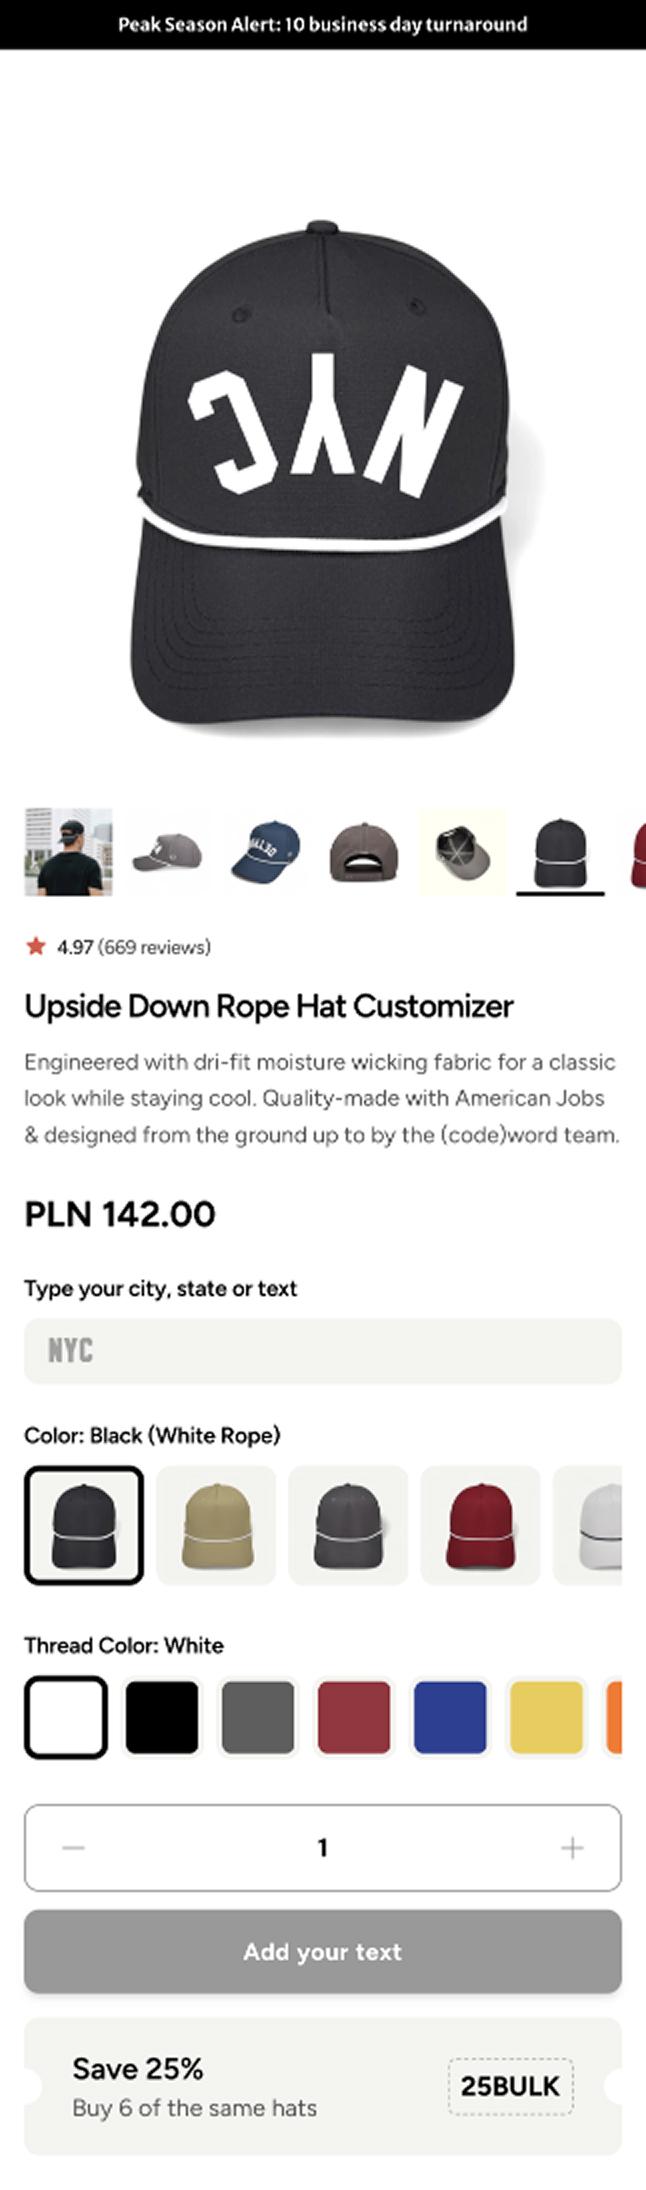
Simplified Text Input Flow Boosts PDP Conversion and User Clarity
Discover how simplifying text input on product pages led to a 4.2% increase in conversion rates and 16.6% more clicks. Explore the full experiment!
-3.1%
Revenue per visitor (RPV)
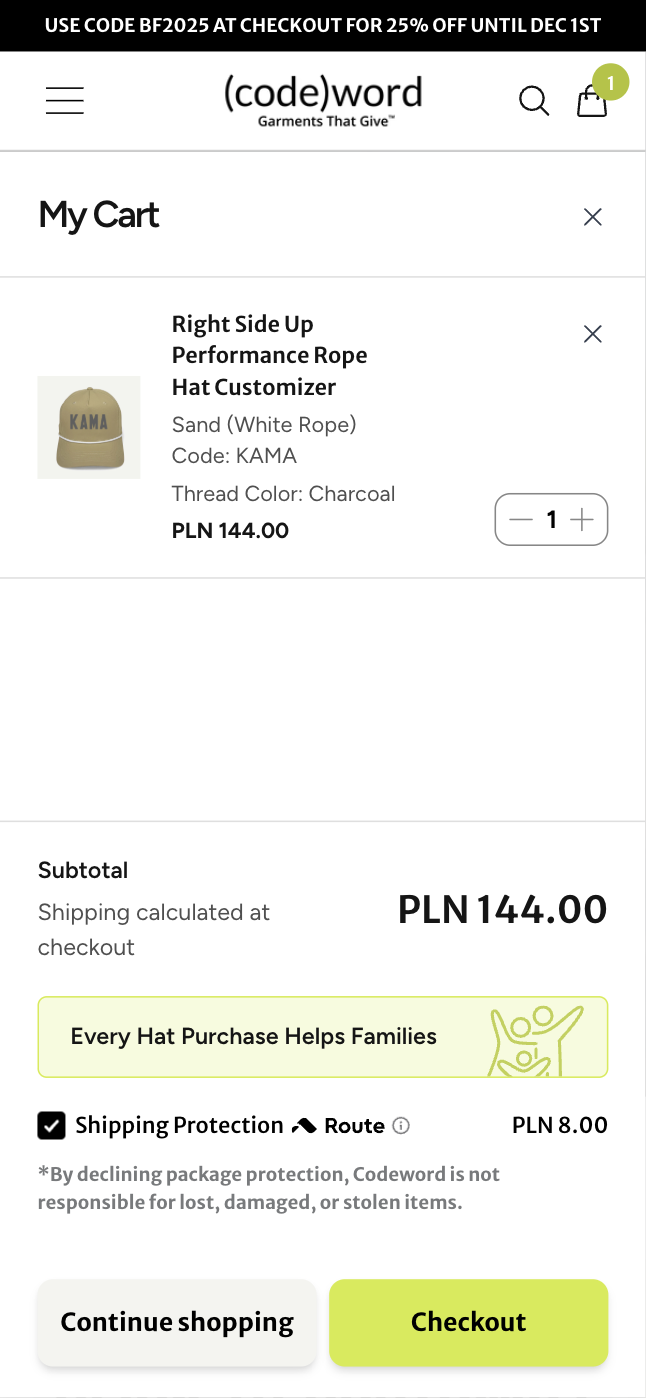
Displaying a charity message in cart and checkout boosts customer motivation to complete purchases
Discover how a charity support message in checkout drove a +3.3% increase in conversion rates and enhanced customer engagement. Explore the insights!
+3.3%
Conversion rate
Repositioning “Hats” to top-level navigation increases visibility and user efficiency
Discover how renaming "Headwear" to "Hats" in navigation improved clickthrough rates by 2.6%, enhancing user engagement and accessibility.
-9.4%
Clickthrough rate
Modern Carousel Controls Boost Product Engagement and Conversion Rates
Discover how a redesigned product image carousel led to a 4.7% rise in conversions, enhancing user engagement and streamlining the shopping process.
-0.5%
Add-to-cart rate
Refined Free Shipping Message on PDP
Discover how a refined free shipping message led to a 7.1% increase in conversion rates. Learn about the impactful changes made!
+7.1%
Conversion rate
Trust-building icons boost checkout confidence and conversions
Discover how trust-building icons on the checkout page enhanced customer confidence, yielding a 0.9% increase in conversion rates. Explore the insights!
+0.9%
Conversion rate
Shipping Info Banner Breaks Down Objections Around Shipping
Discover how adding a persistent shipping info banner enhanced user trust, resulting in a 1.5% increase in conversion rate. Explore the results!
+1.5%
Conversion rate
Add-to-Cart Button on Mobile Collection Pages To Boost Purchase Convenience
Discover how adding an "Add to Cart" button on mobile collection pages changed user behavior and impacted performance metrics.
-2.7%
Add-to-cart rate
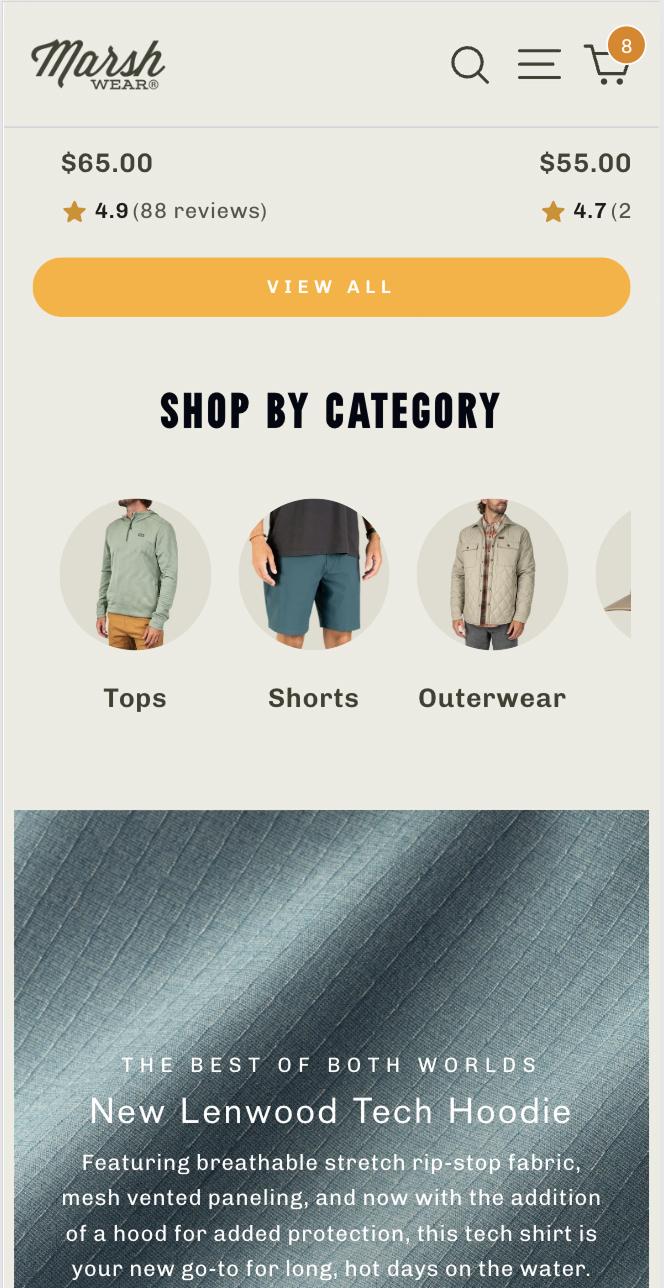
Relocating 'Shop by Category' Below the Hero to Boost Visibility and User Engagement
Discover how repositioning the "Shop by Category" section impacted user engagement and conversions. Learn from our insights and experiment results!
-0.1%
Clickthrough rate
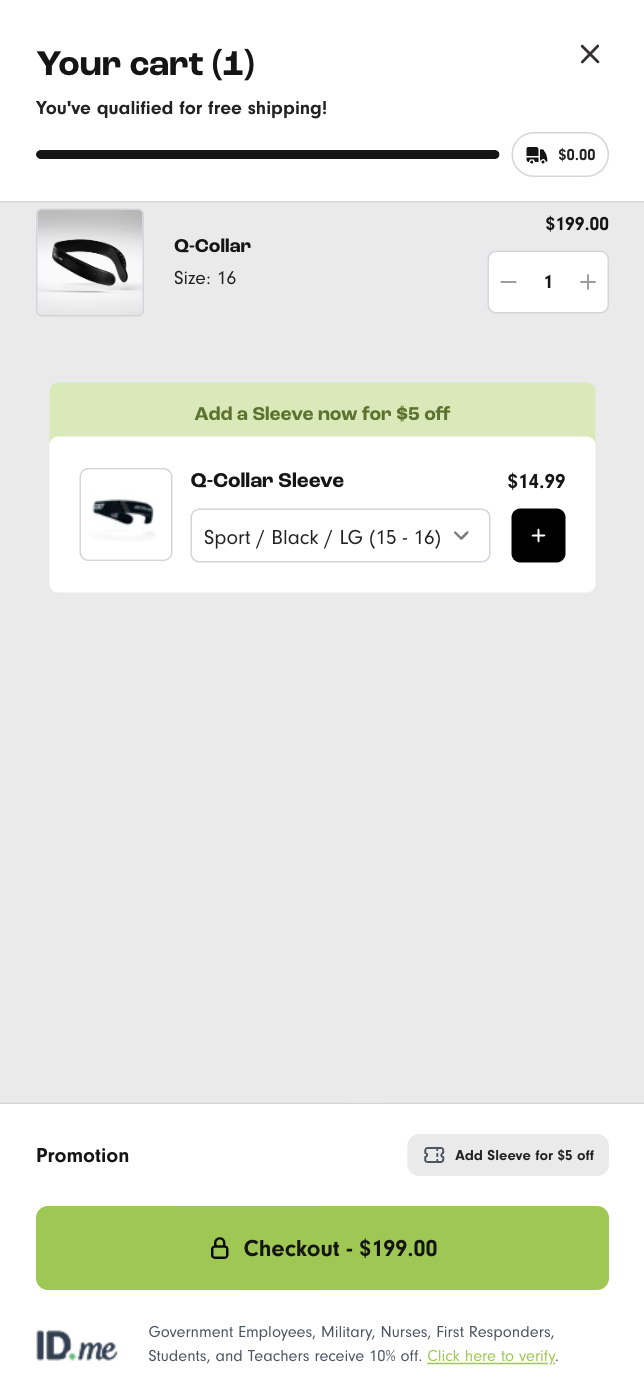
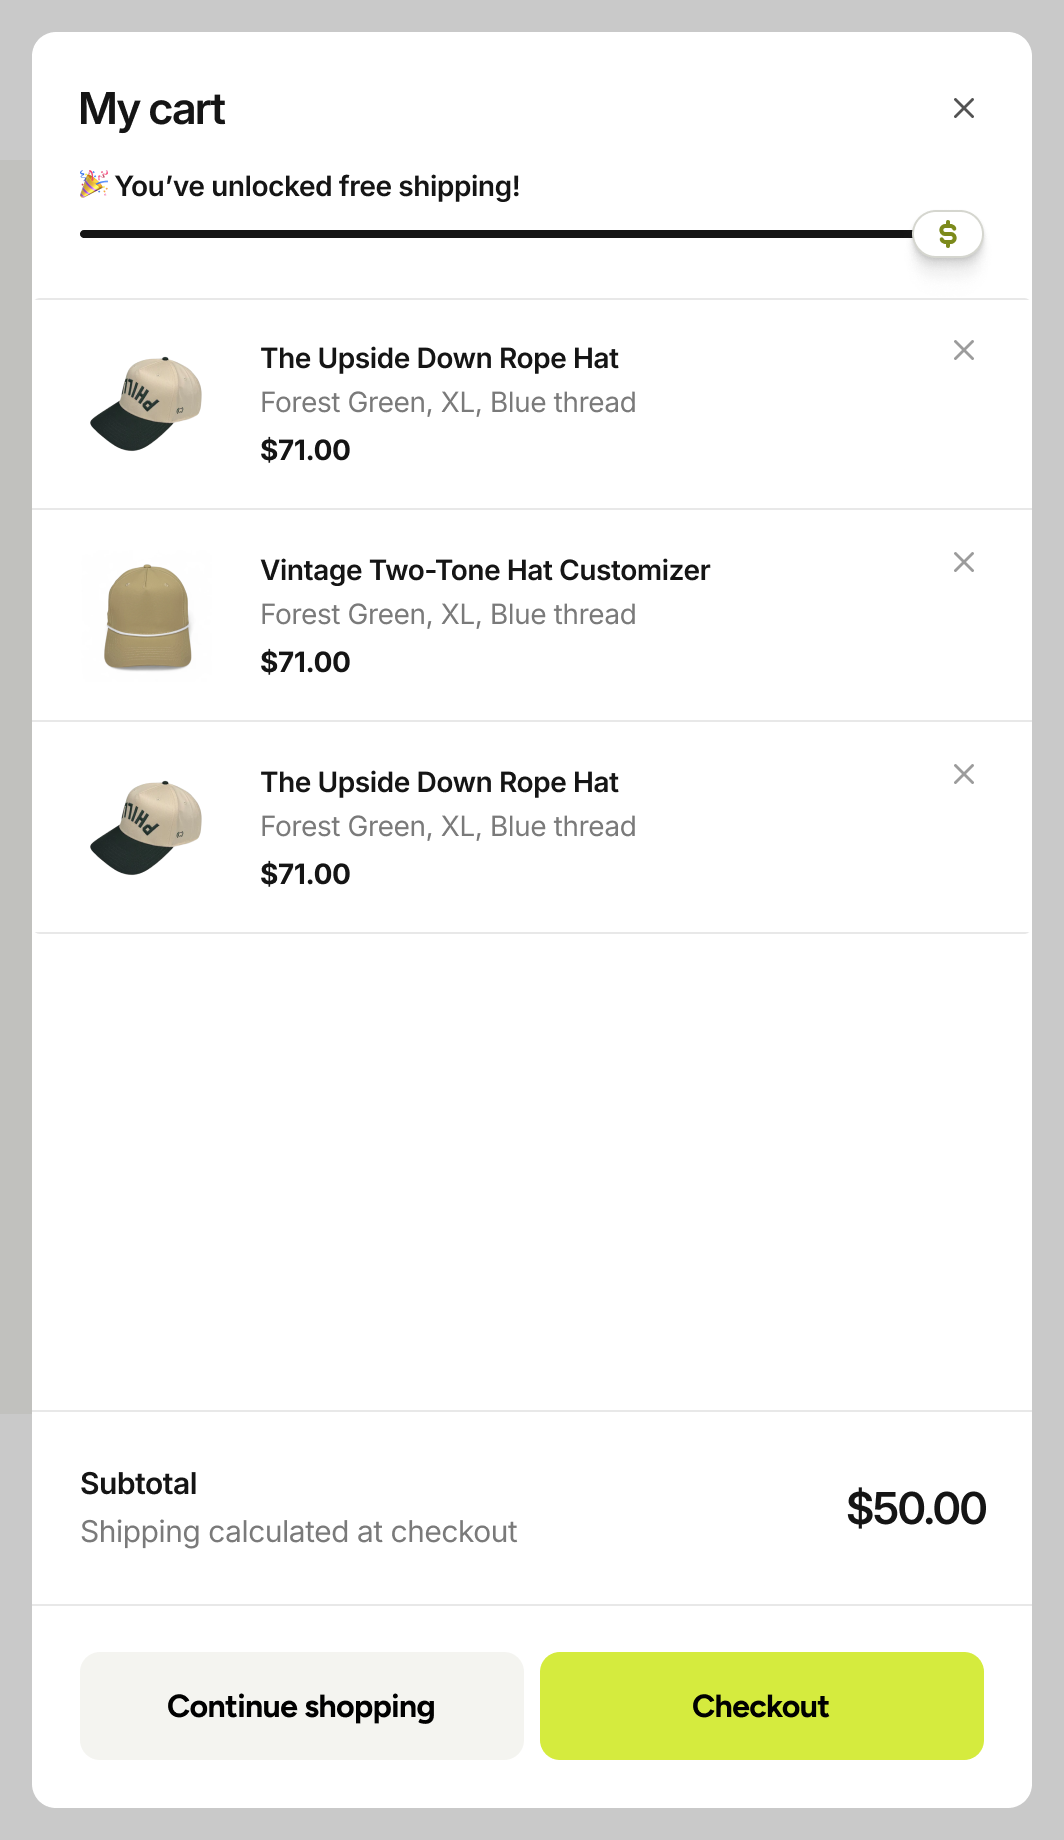
Mini-cart redesign with highlighted checkout button boosts conversions and revenue
Discover how a minicart redesign and clearer button placement led to a remarkable 26.7% increase in conversion rate. Get inspired by this experiment!
+46.6%
Revenue per visitor (RPV)
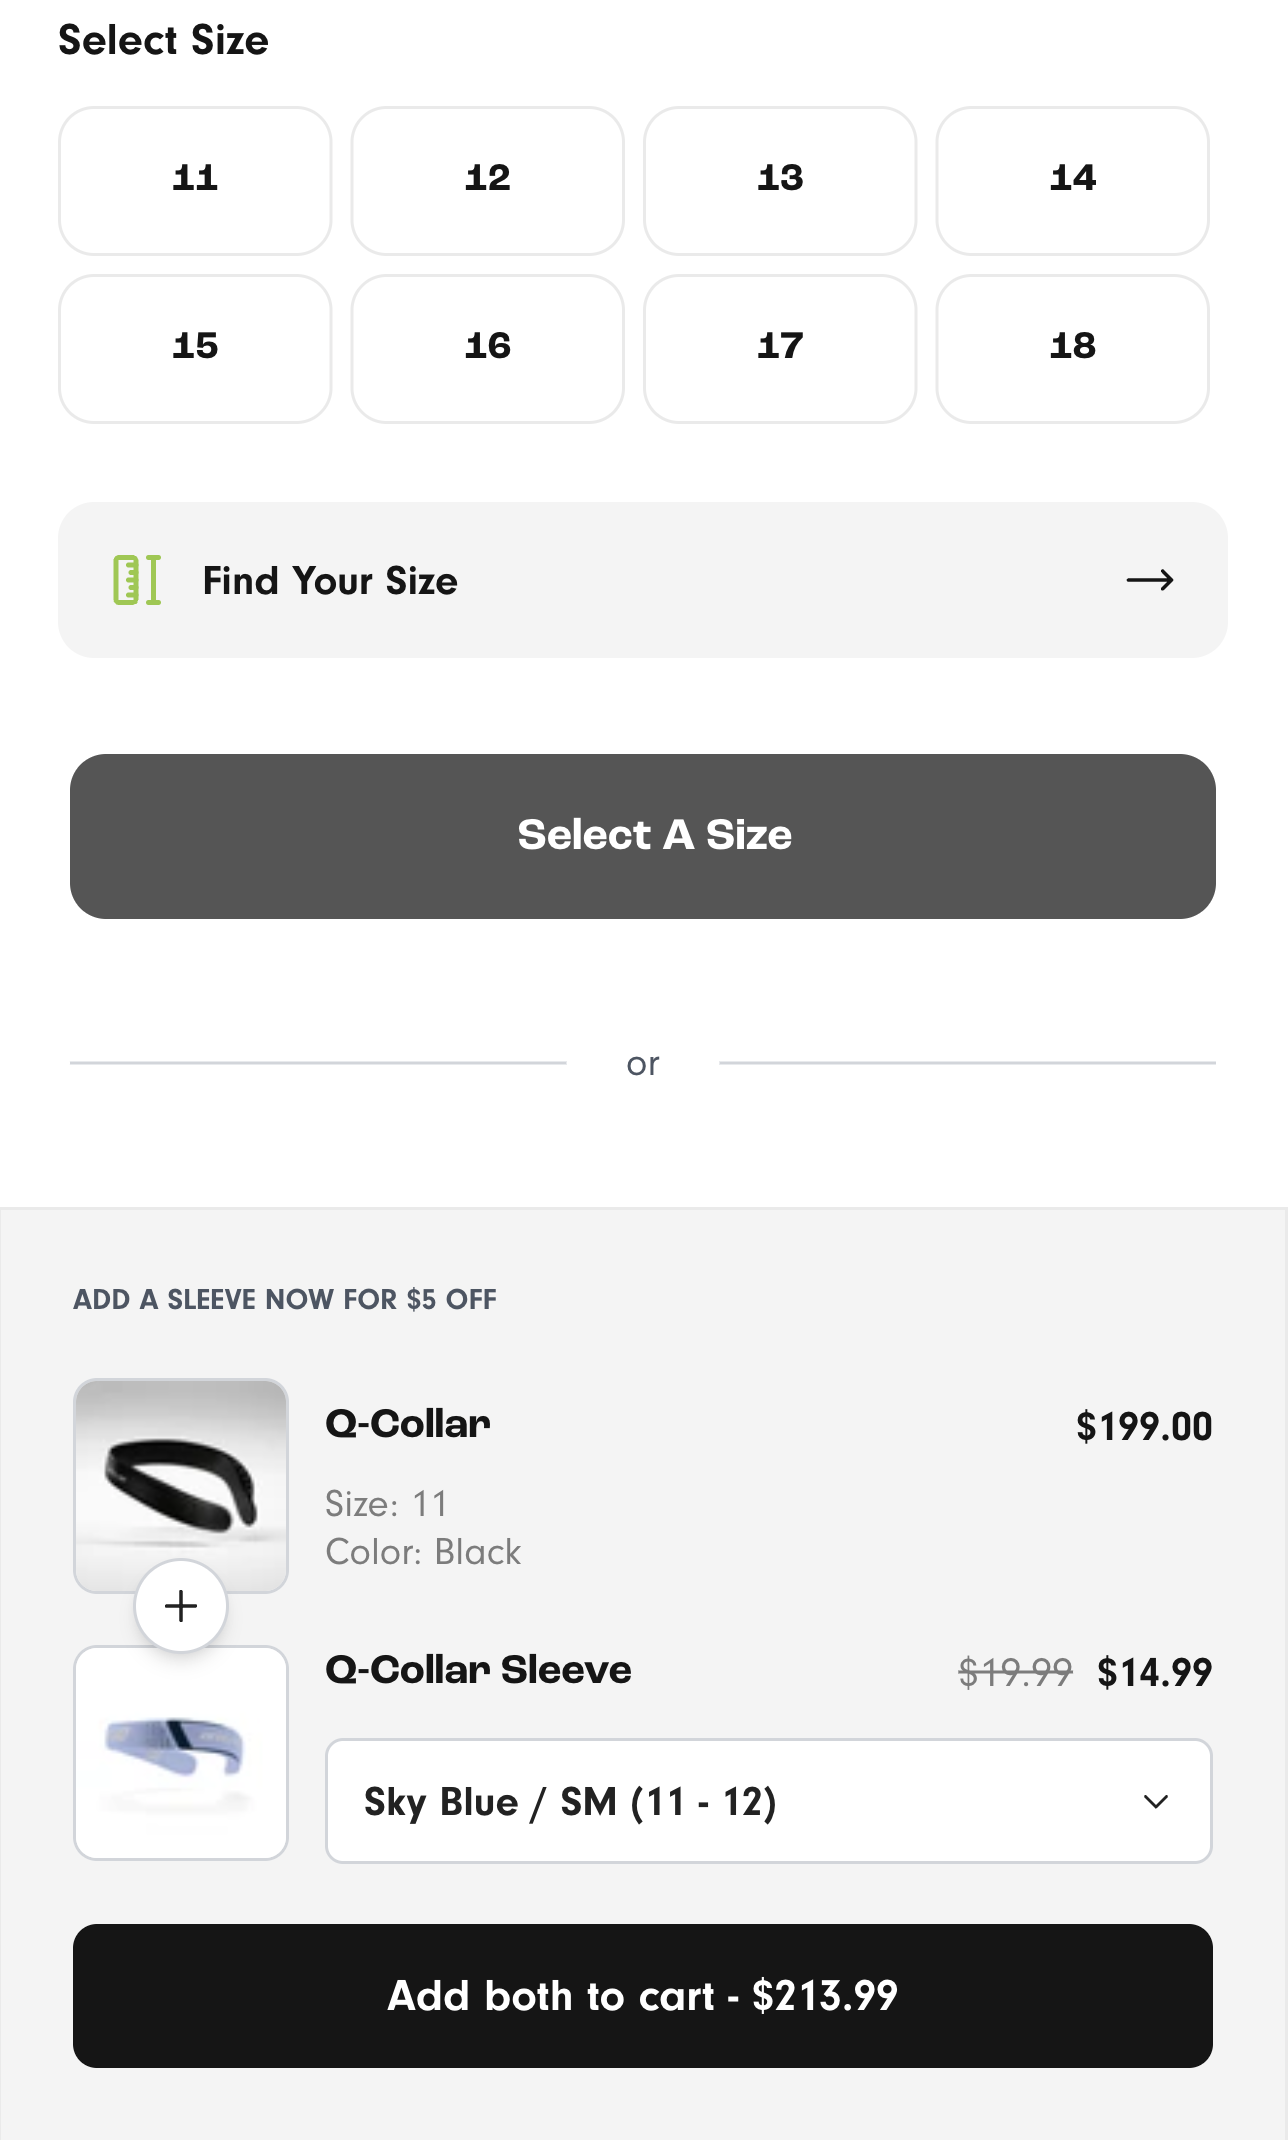
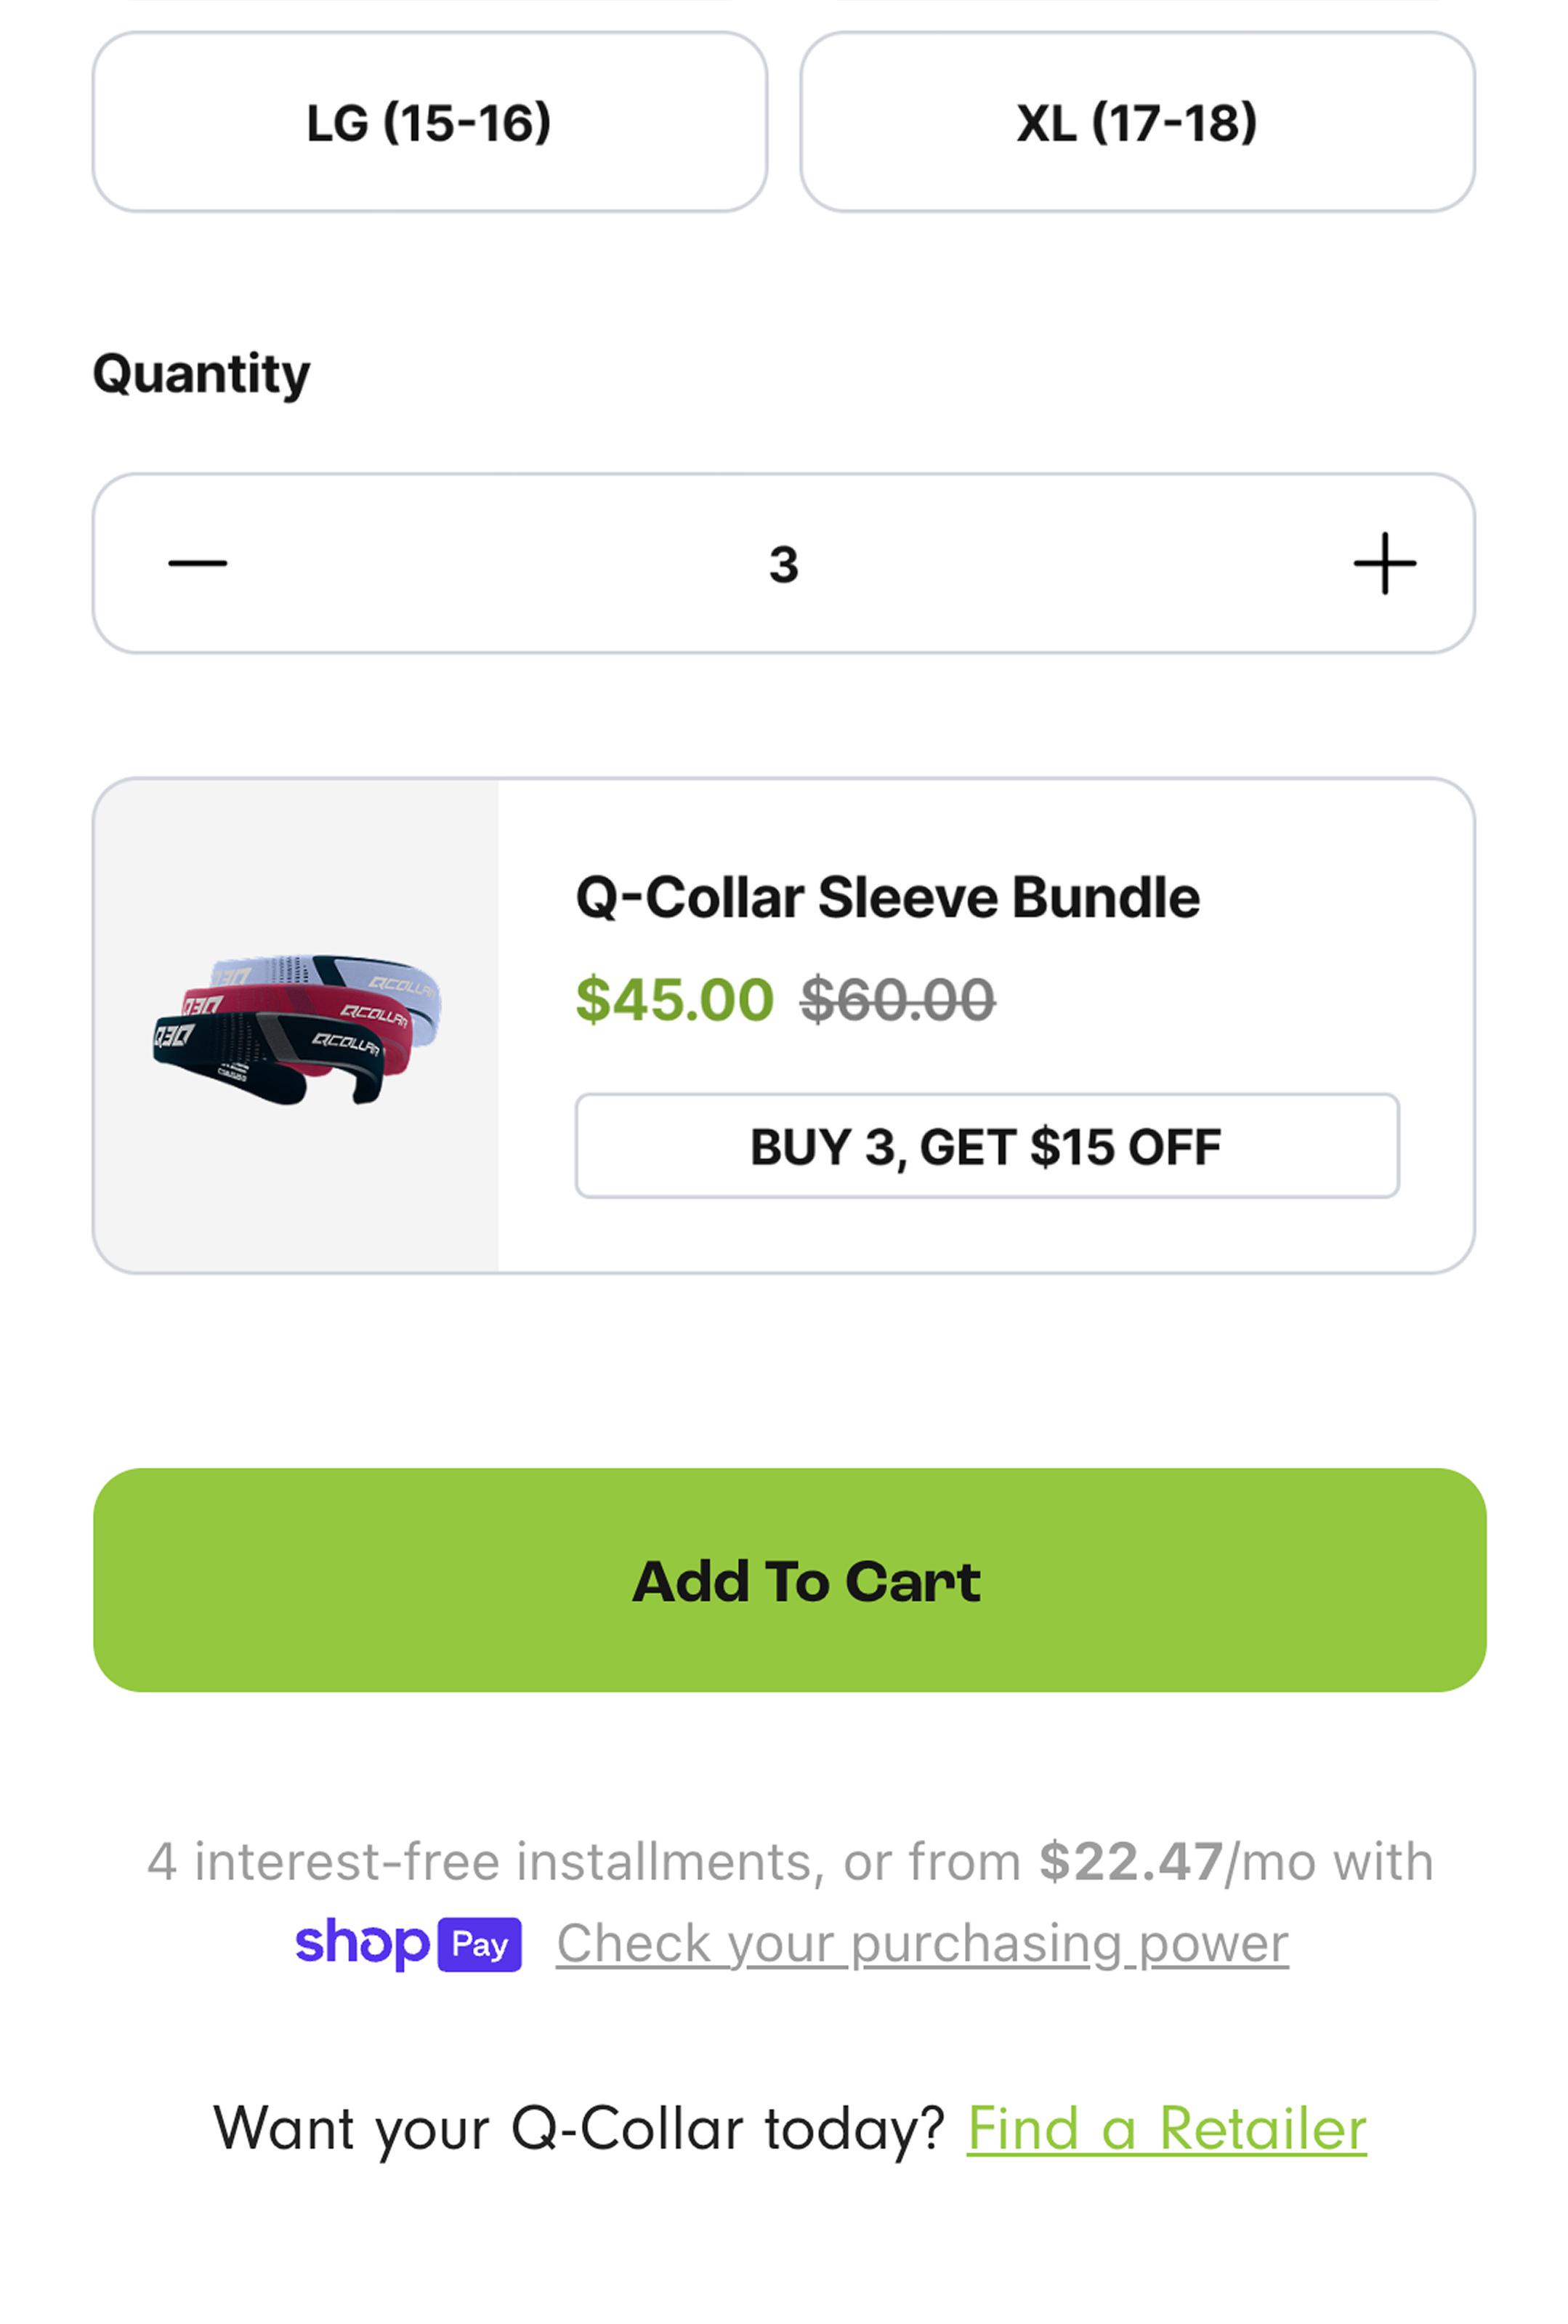
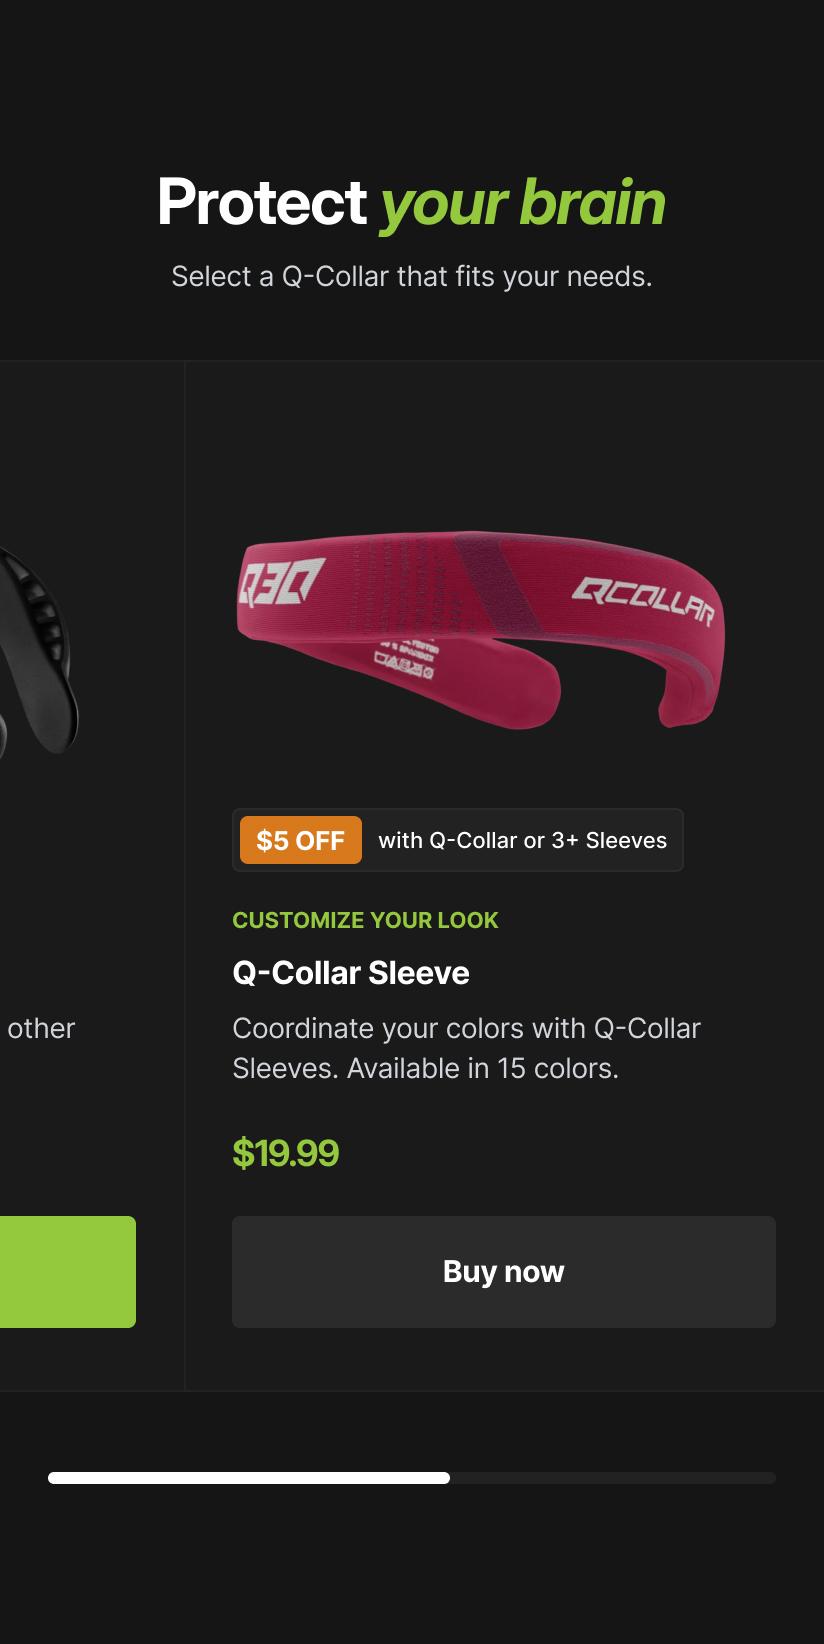
Boosting AOV with Collar and Sleeve Bundle Promotion on PDP
Discover how a bundle promotion near the Add to Cart button led to a 9.8% increase in average order value and a 23% rise in click-through rates.
+0.6%
Revenue per visitor (RPV)
Prominent Discount Messaging Boosts Conversions and Revenue Across Devices
Discover how showcasing a 10% discount for select groups led to a 31.5% increase in mobile conversions and enhanced user engagement.
+1.2%
Conversion rate
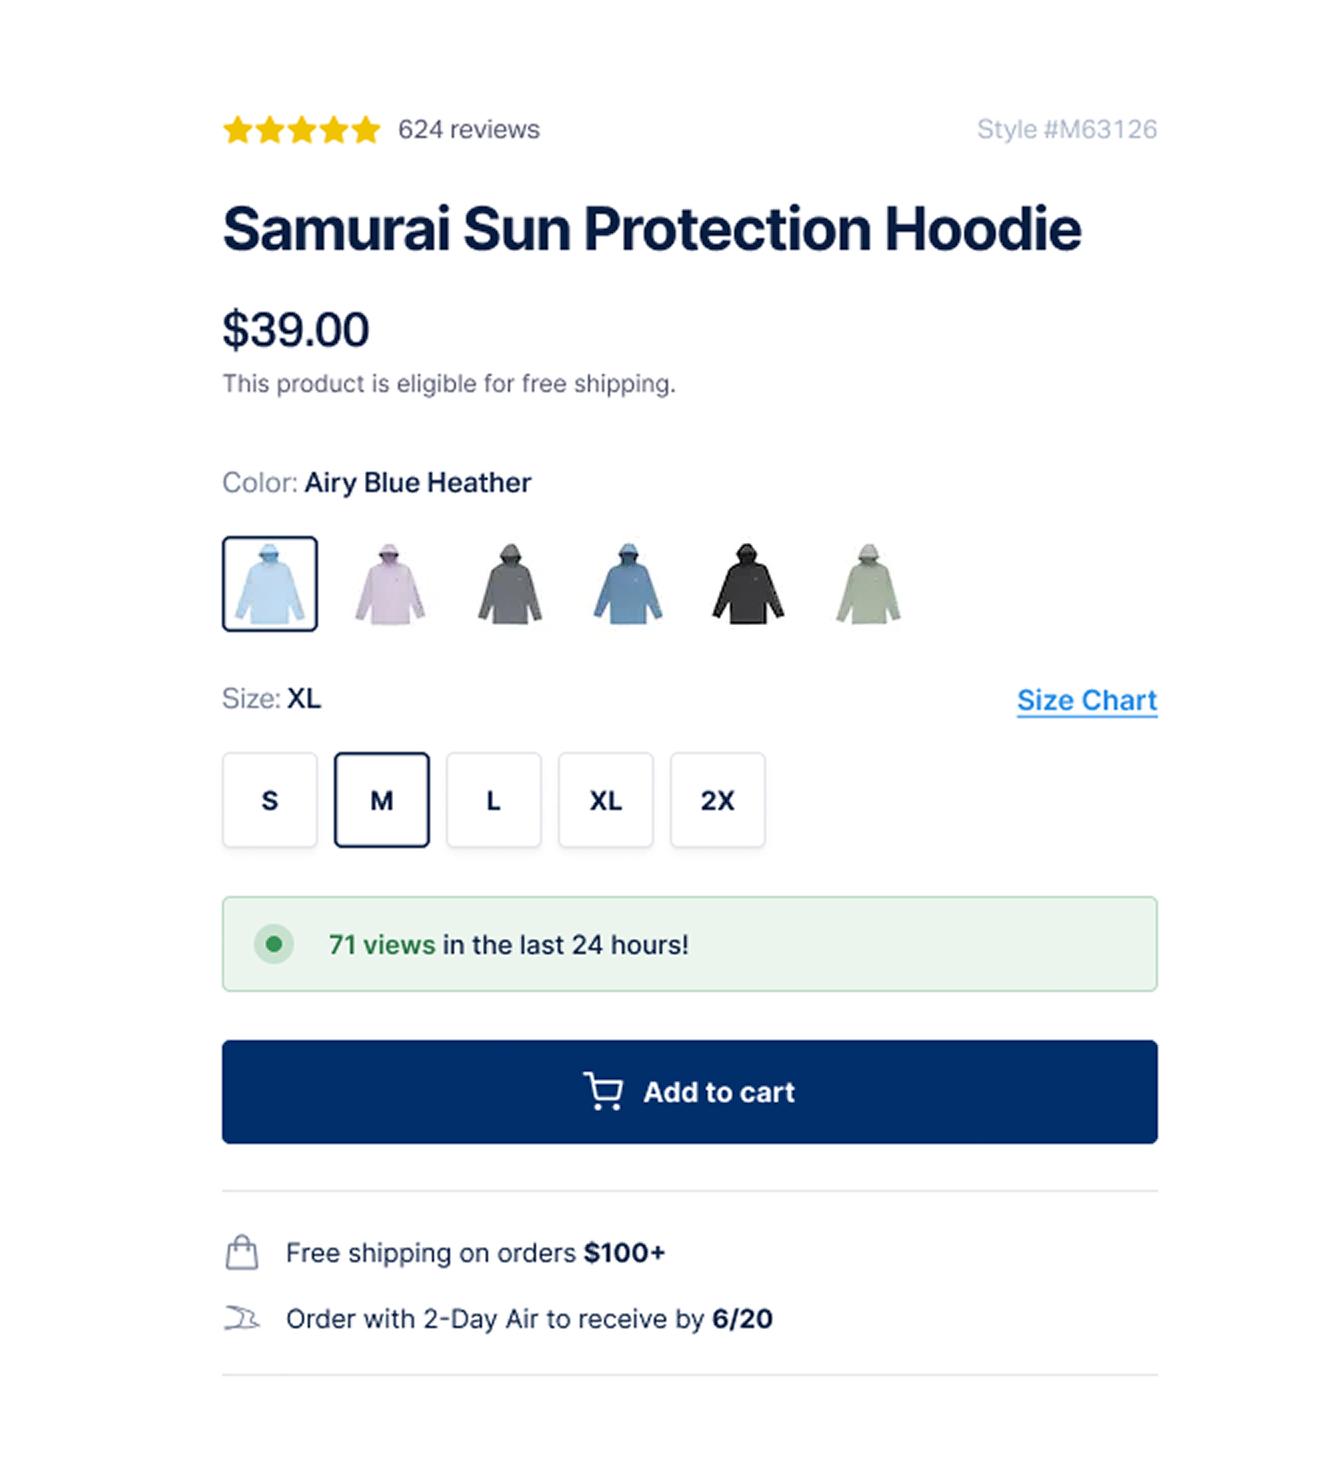
Transforming the Sticky Add to Cart into a Persistent Bottom Bar
Transform your product page with a sticky Add to Cart bar and explore how it increased conversion rates by 3.7%. Discover the results!
+3.7%
Conversion rate
Enhanced Collection Filtering by Hat Attributes
Explore how a dynamic filter system transformed user experience, boosting clicks by 9.6% while reducing bounce rates by 40.5%. Discover the details!
-6.4%
Conversion rate
Directing Ads Traffic to the Homepage Boosts Conversions and Revenue
Discover how redirecting traffic to the Homepage led to a +103.9% increase in conversions and improved overall user engagement.
+83.5%
Add-to-cart rate
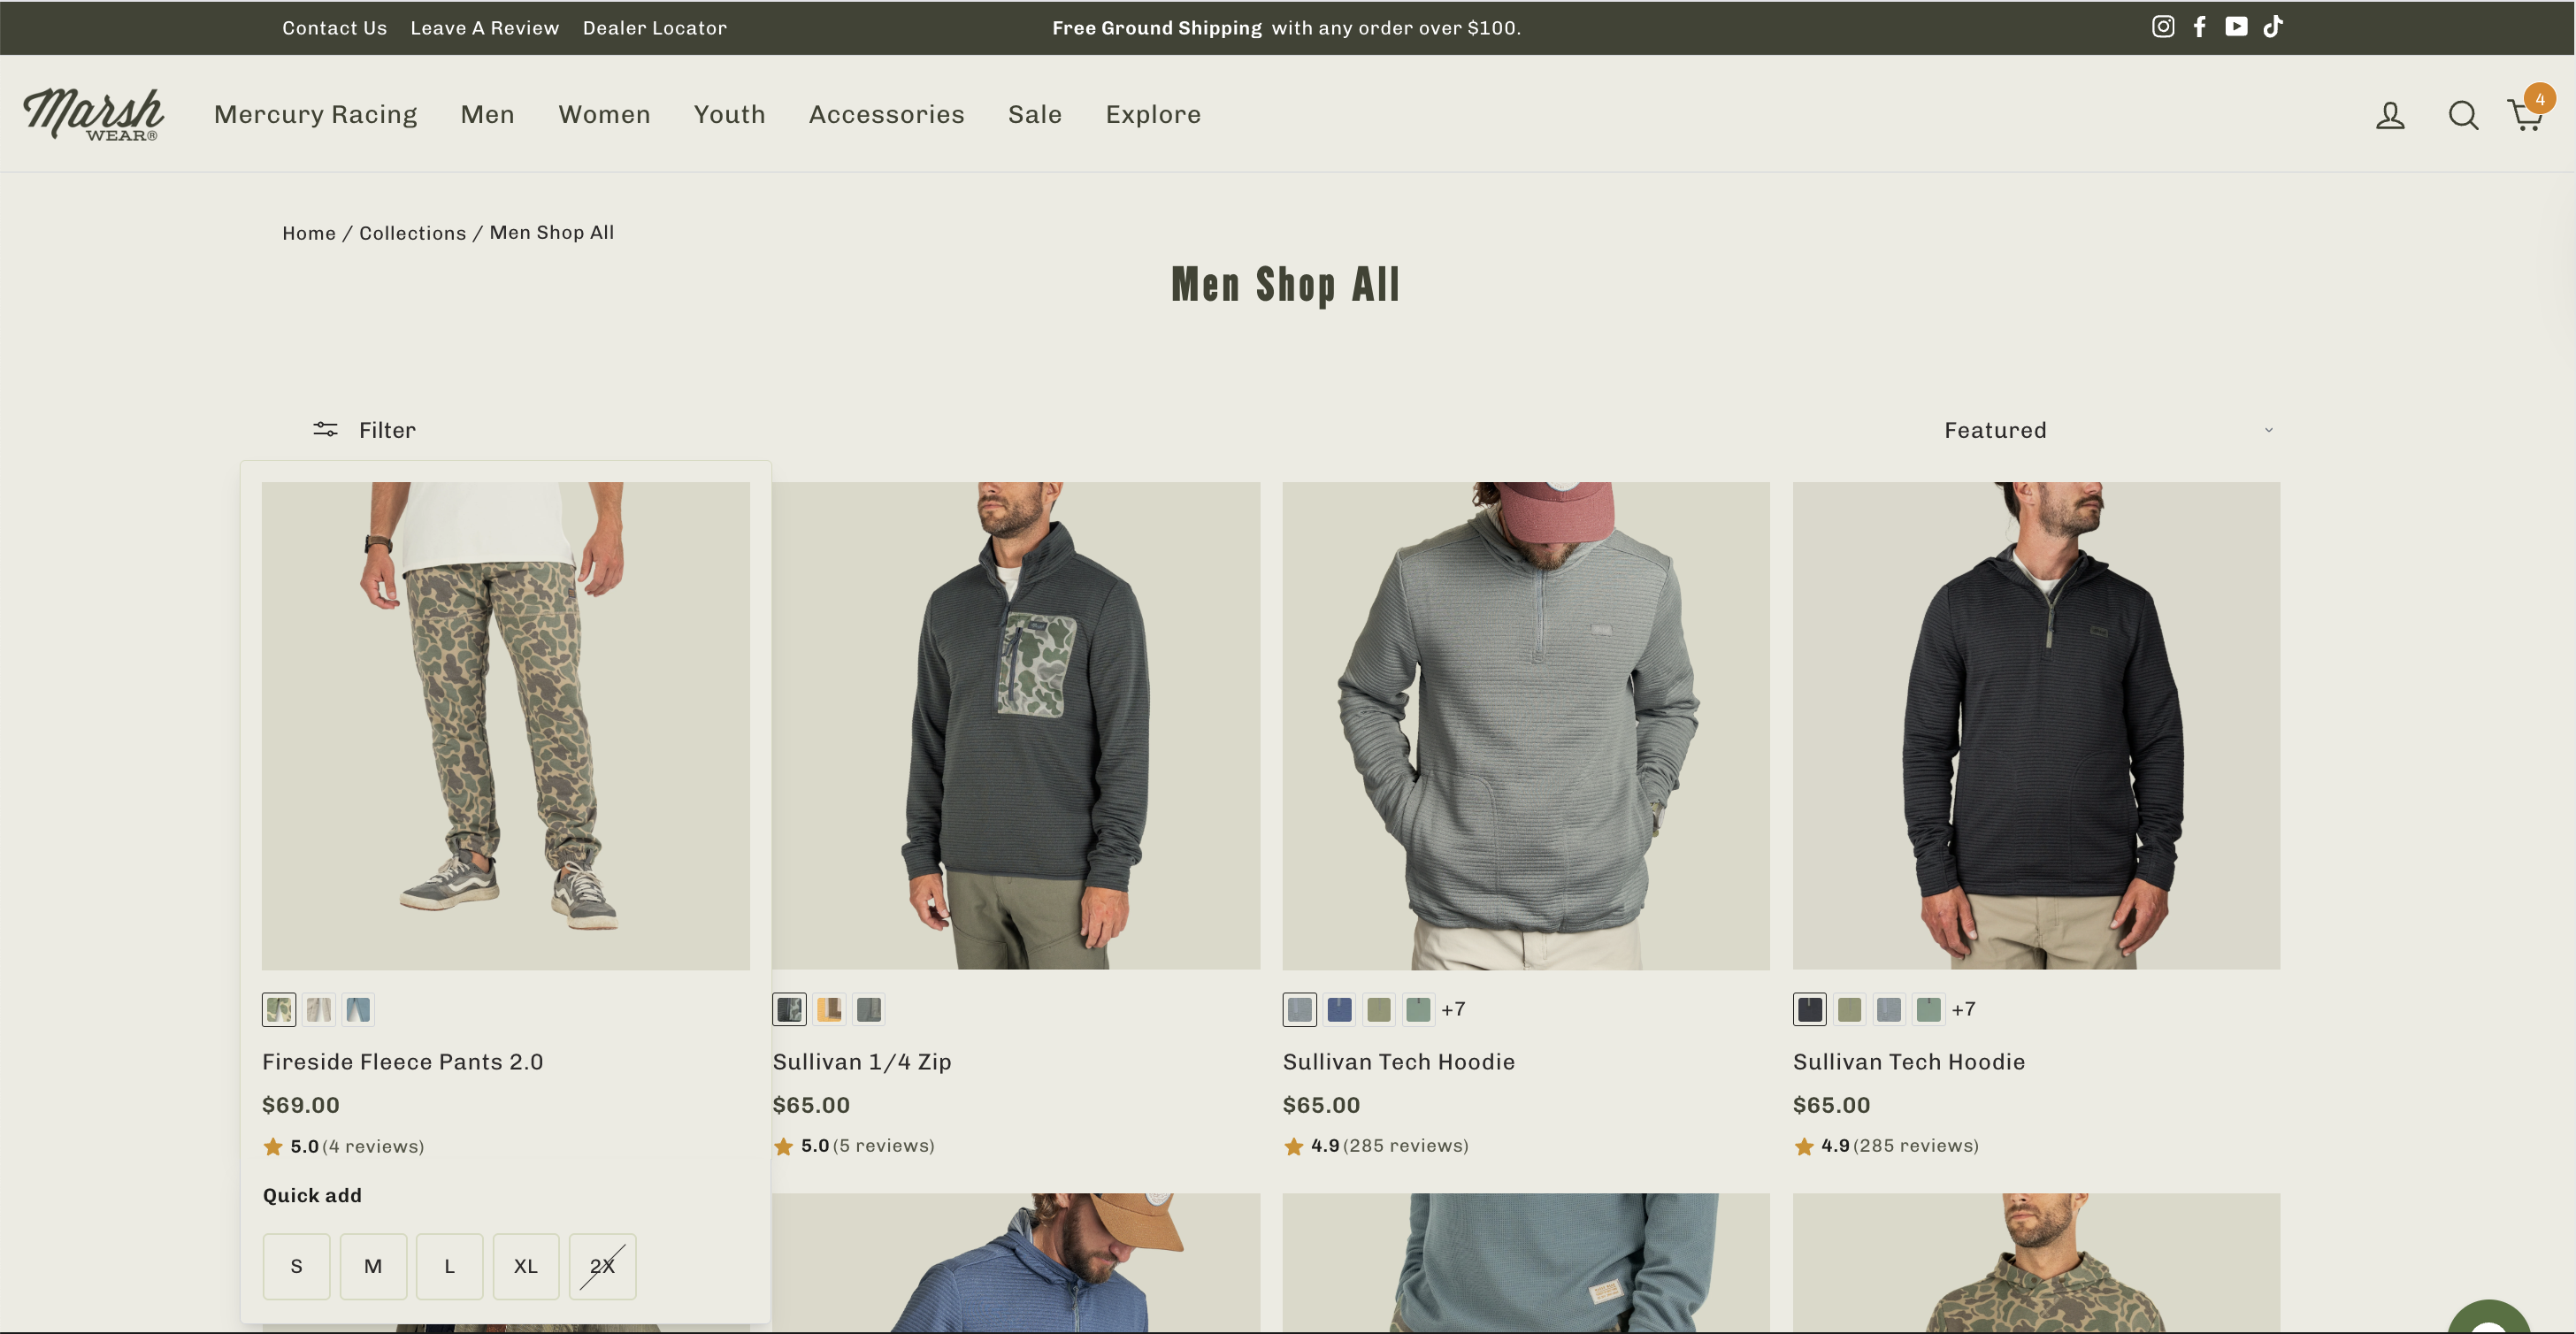
Desktop Collection Hover Sizing Buttons
Discover how clickable size buttons on product cards enhanced user engagement and increased add-to-cart actions by 17.3%. Explore the results now!
+7.3%
Conversion rate
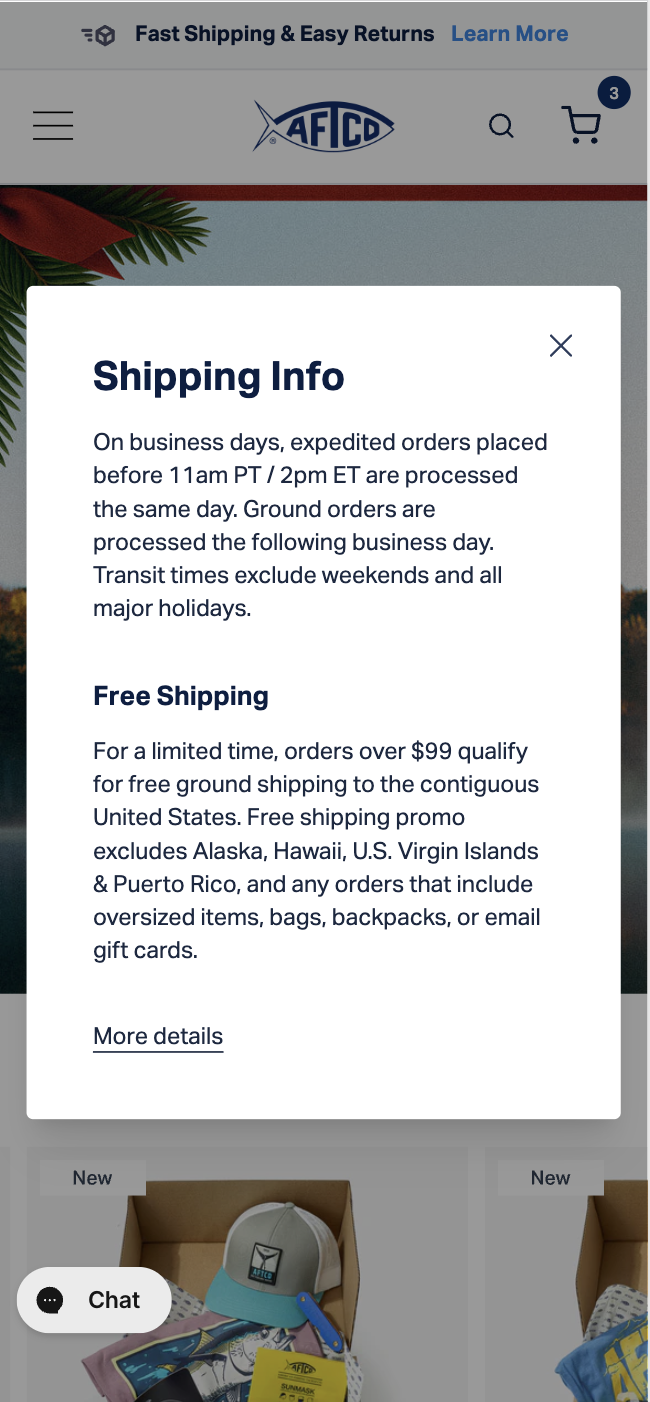
Shipping Banner with Info Modal
Discover how a shipping info banner increased user confidence and improved conversions by 4.7%. Explore the results of this impactful change!
+4.7%
Conversion rate
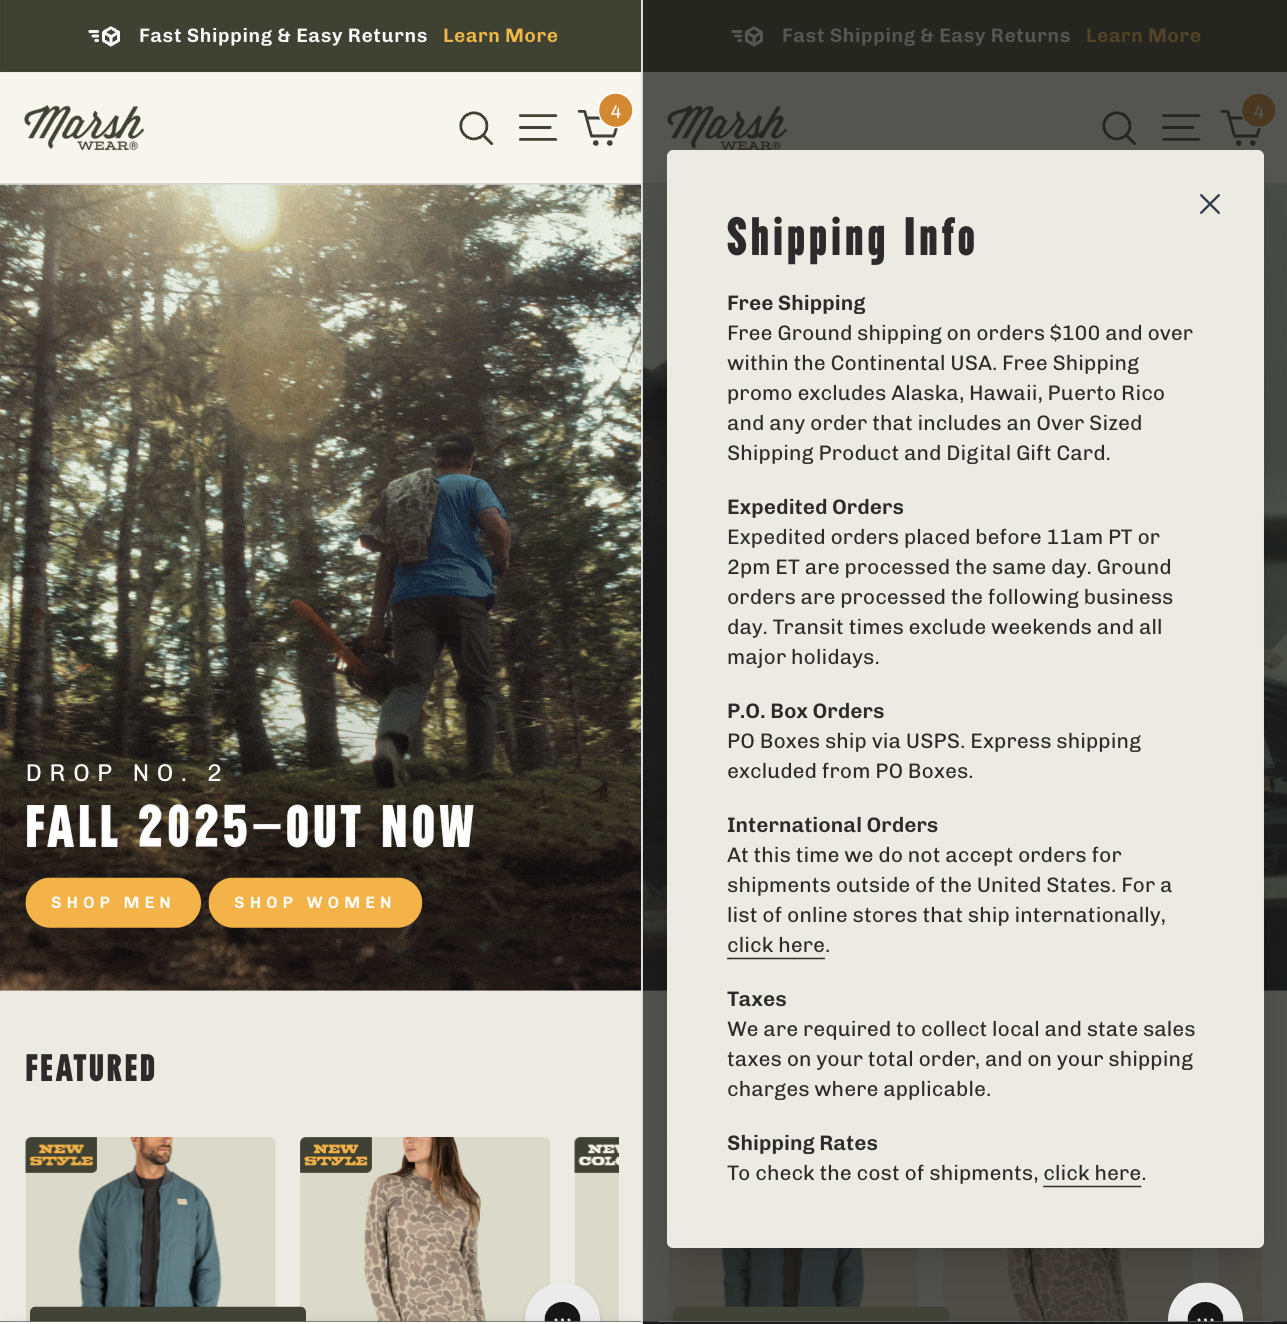
Shipping info banner that expand announcement bar information
Discover how adding a shipping info banner led to a 3.3% increase in conversions. Uncover strategies that enhance customer trust and engagement.
+3.3%
Conversion rate
Sticky Product Customization Below The Fold
Discover how a sticky customization bar altered user interactions, increasing click-through rates by 13.8% but not conversions. Explore the insights!
-14.4%
Conversion rate
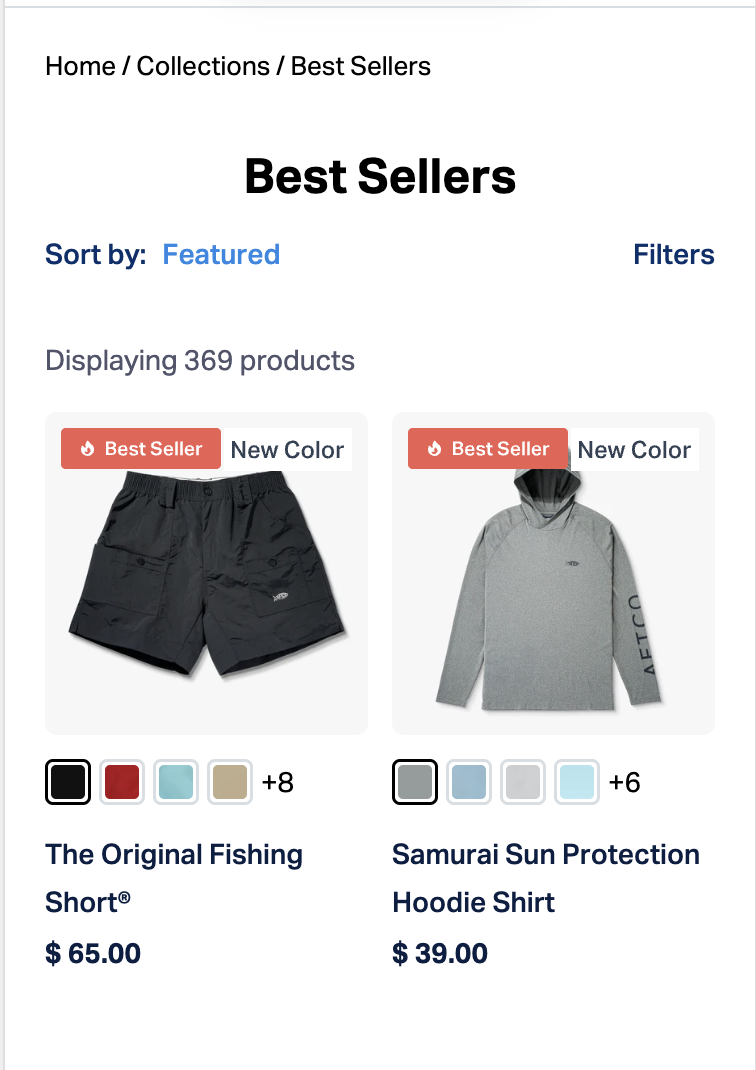
Best Sellers Module Added Below Hero
Discover how adding a Best Sellers module elevated conversions by 16.9%. Explore the impact of showcasing popular products on user engagement!
+16.9%
Conversion rate
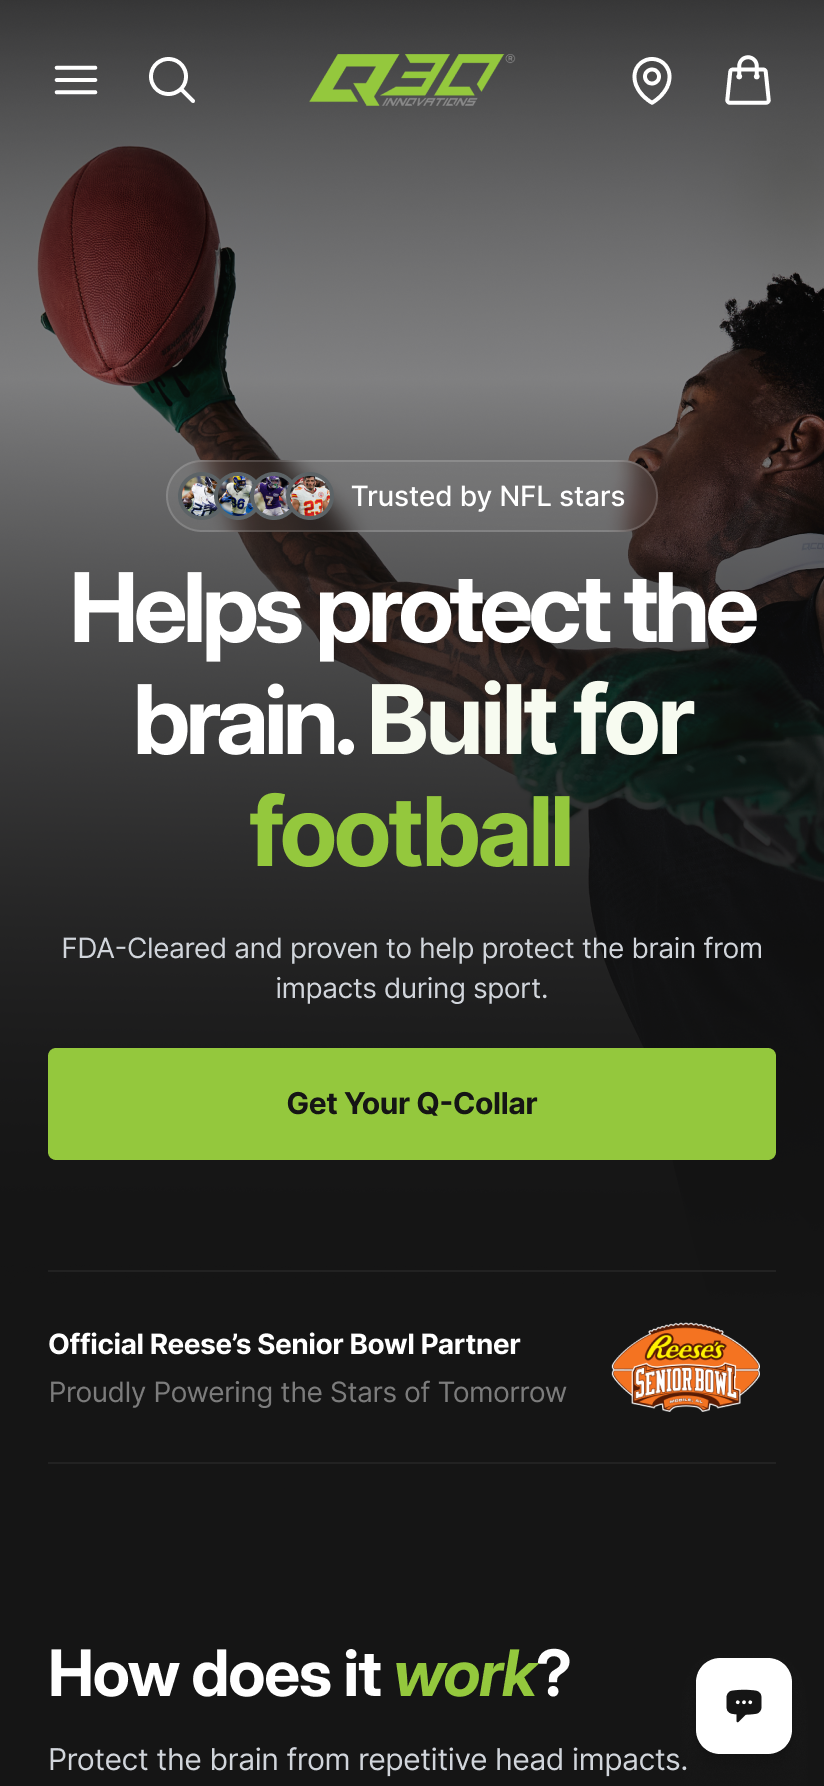
Redesigned Football Landing Page
Transform your football landing page with engaging visuals and social proof, leading to a stunning 19.1% increase in conversions. Explore the results!
+19.1%
Conversion rate
Personalized PDP Layout for Returning Visitors
Discover how personalized product pages for new and returning users improved engagement.
-2.8%
Conversion rate
Personalized PDP Layout for New Visitors
Discover how personalized product detail pages for new and returning visitors led to a 2.4% increase in conversion rates and improved engagement.
+1.9%
Conversion rate
Collection Pages with Quick Add-to-Cart Button
Discover how adding an "Add to Cart" button on mobile collection pages influenced user engagement and purchasing behavior. Explore the results!
-5.6%
Conversion rate
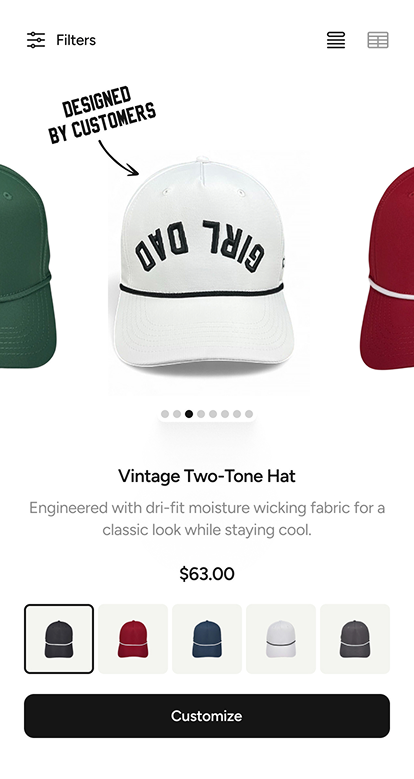
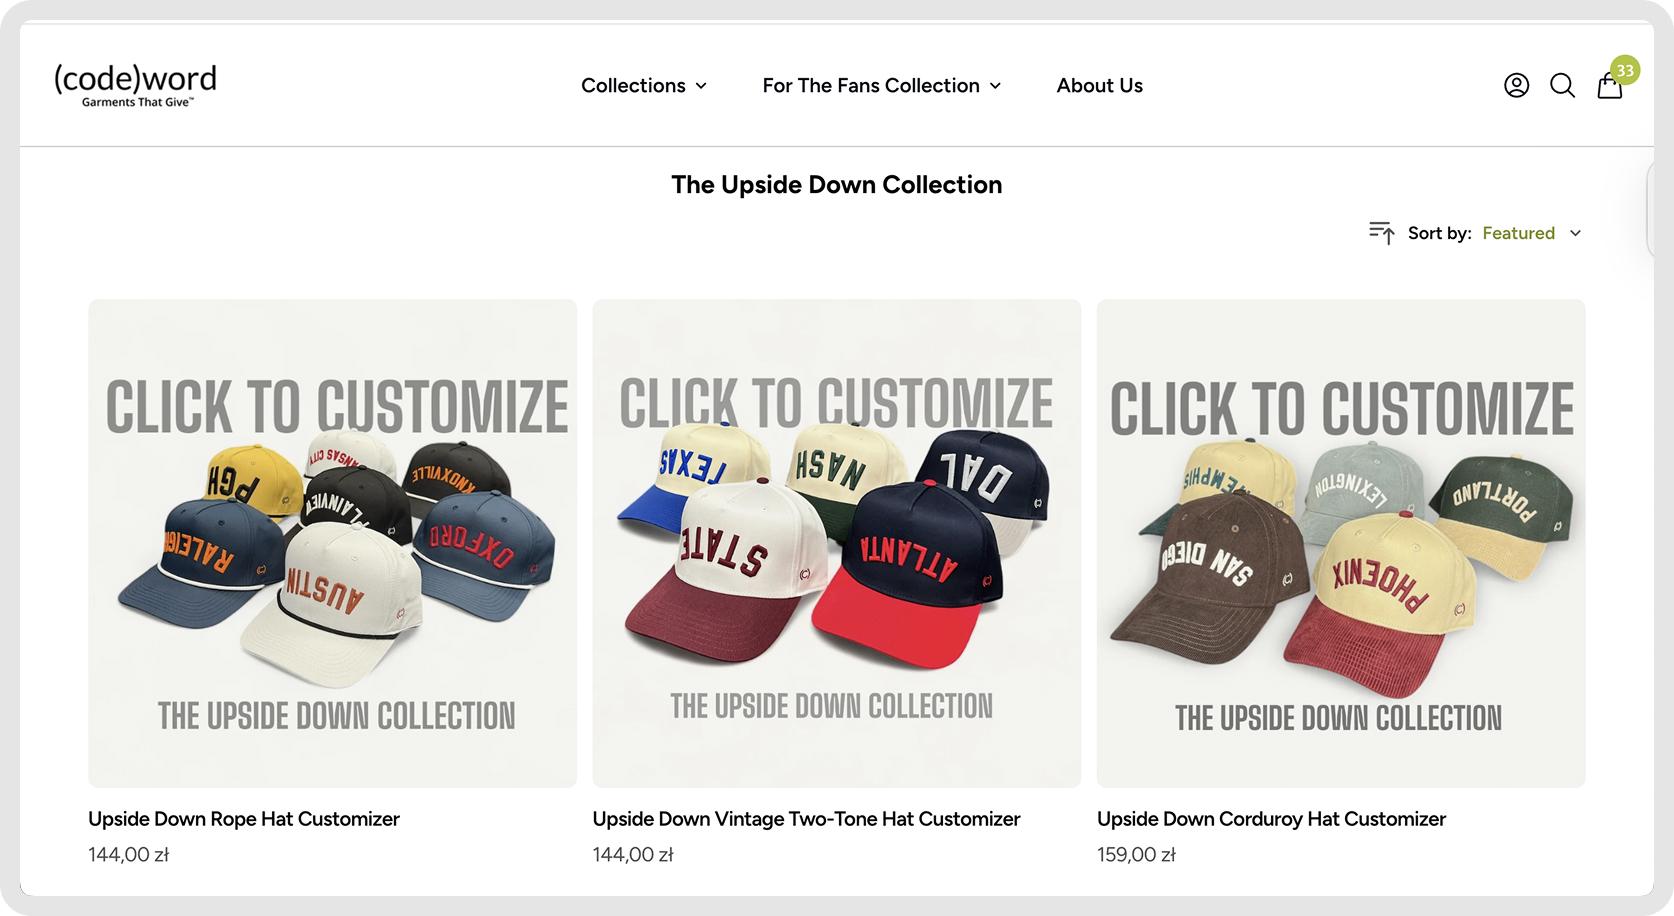
Adding 'Customise' Badge and Real-Life Images on Product Cards Boosts Visibility of Customizable Products
Discover how adding a "Customise" badge and real-life images impacted engagement, with a notable 5.1% increase in add-to-cart actions.
-5.0%
Conversion rate
Condensed Product Gallery Increases Conversions
Discover how reducing product image gallery height led to a 24% increase in conversions and enhanced user engagement. Explore the results now!
+23.9%
Conversion rate
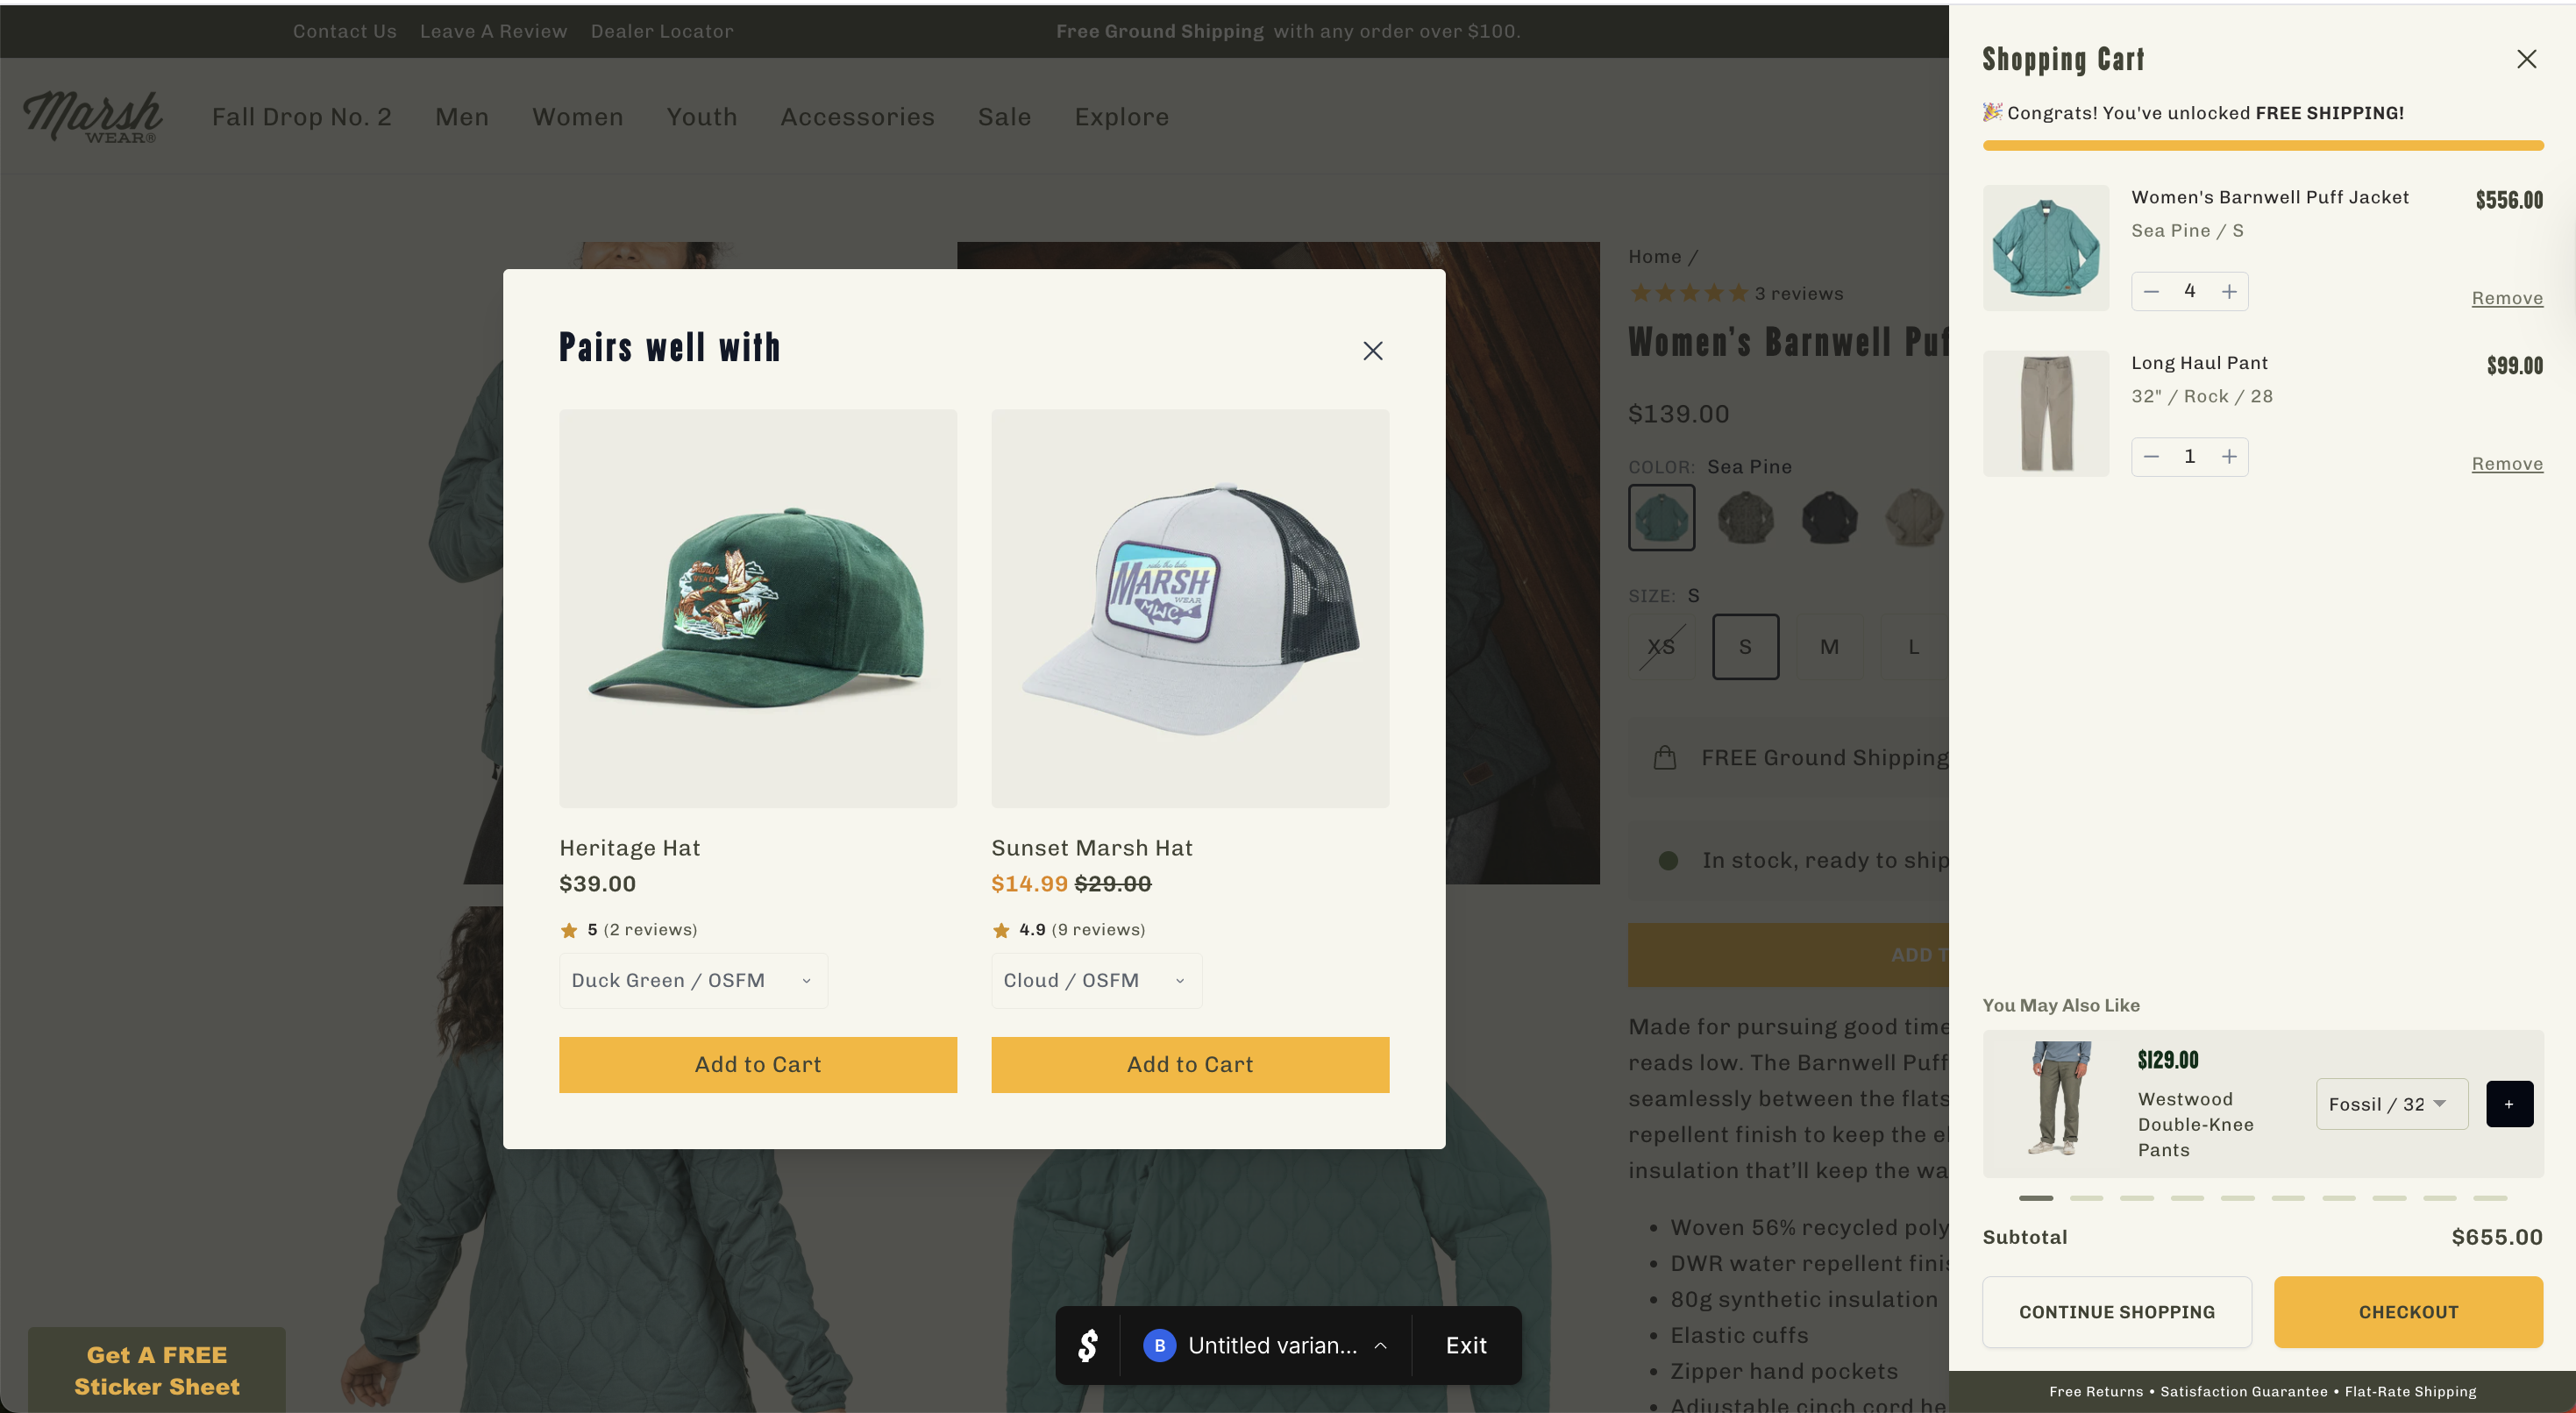
Enhancing AOV with Cross-Sell Pop-up Recommendations
Elevate customer engagement with a pop-up suggesting complementary products, leading to a 6.5% increase in conversions. Discover the strategy!
+13.0%
Average order value
Modern Image Carousel Controls to Enhance Usability
Discover how a redesigned image carousel enhanced user engagement with a 4.5% lift in add-to-cart actions and improved navigation experience.
+4.5%
Add-to-cart rate
Sticky Bottom Add to Cart Bar
Discover how optimizing mobile navigation and load speed led to an 8.2% drop in bounce rate and improved user engagement.
+0.0%
Conversion rate
Tactical Bottom Sticky Add-to-Cart
Uncover how enhancing the add-to-cart process led to a 45.3% increase in engagement and reduced bounce rates. Discover the full impact!
-10.6%
Conversion rate
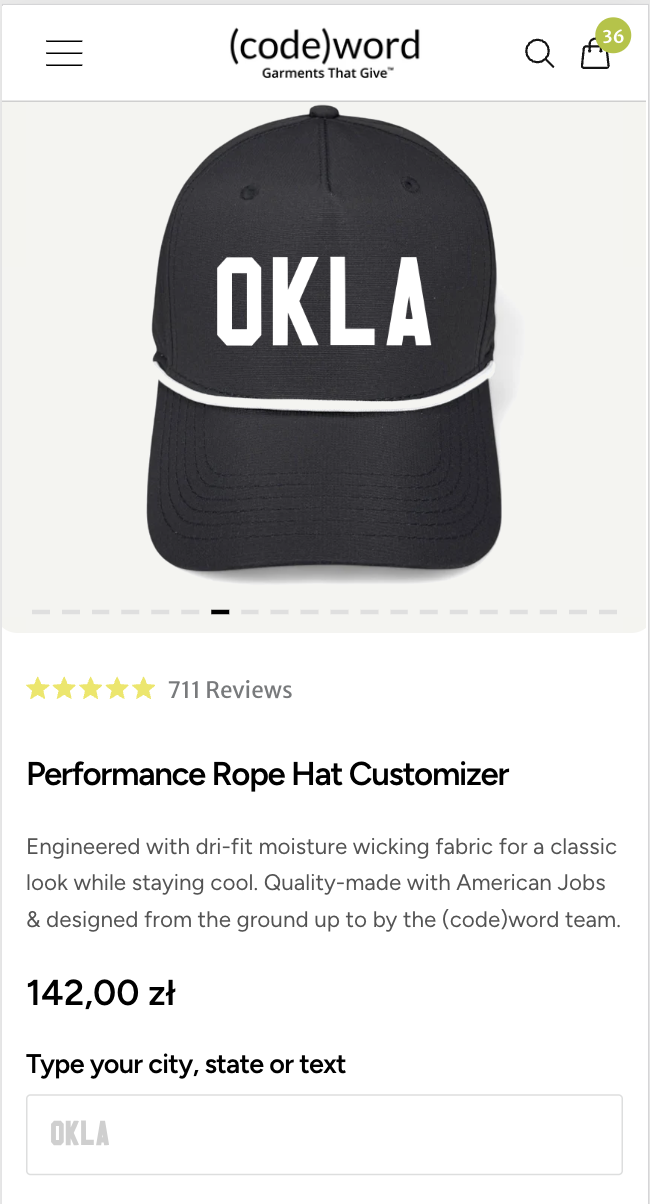
"Customize Your Own Hat" Button
Discover how a persistent "Customize Your Own Hat" button increased clickthrough rates by 6.6%. Uncover the unexpected results and insights!
+15.4%
Revenue per visitor (RPV)
Enhancing Homepage Credibility with Curated User-Generated Content
Discover how a modular UGC carousel improved engagement and lifted conversion rates by 6.1%. Explore the impact of real-life imagery now!
+6.1%
Conversion rate
Product page redesign with updated fields boosts engagement and revenue
Discover how redesigning the product page led to a 12.55% revenue increase and improved user engagement. Explore our insights and strategies!
+0.5%
Conversion rate
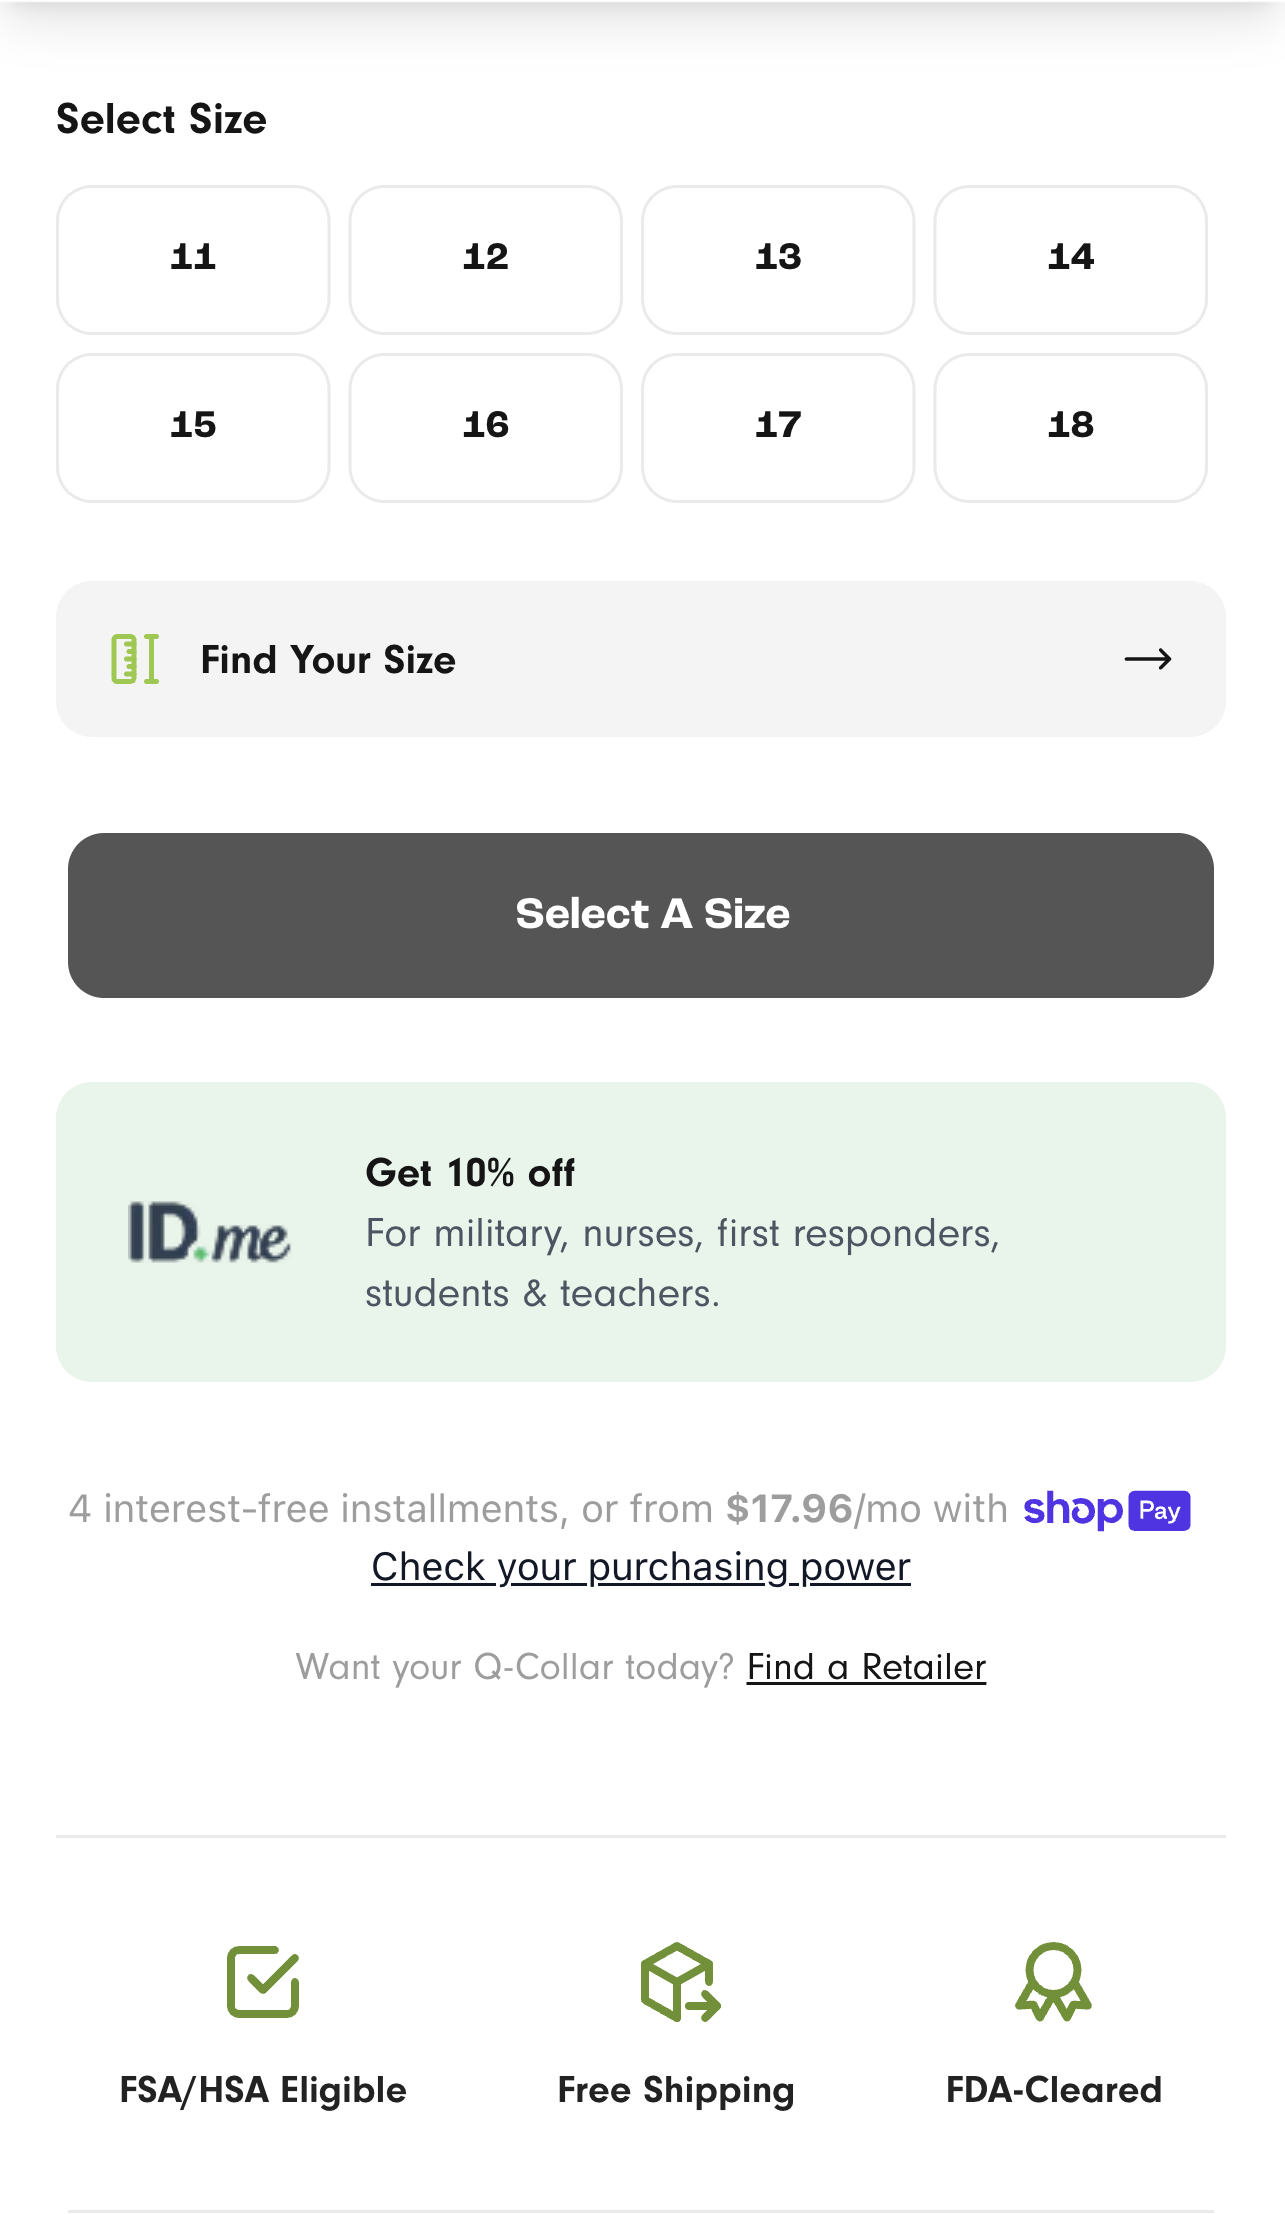
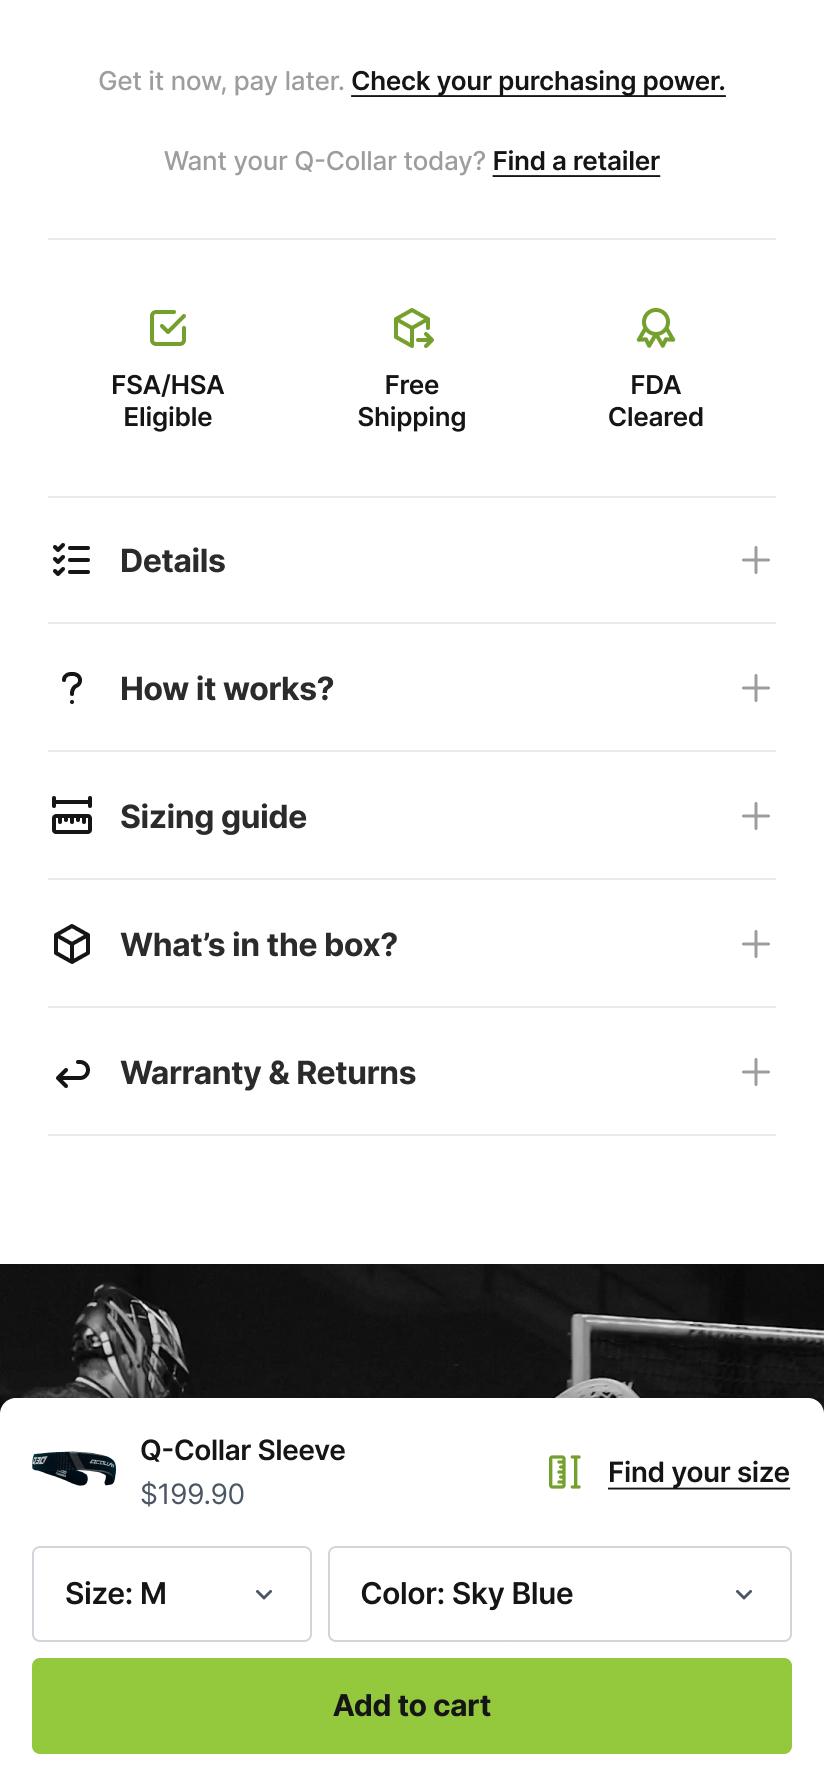
Highlighting HSA/FSA Eligibility Boosts Homepage Conversion and Revenue
Discover how adding HSA/FSA eligibility messaging transformed customer confidence and led to a 12.1% increase in conversion rates.
+12.1%
Conversion rate
Category Links Boosts User Engagement and Conversions on Mobile
Discover how adding category links on the homepage improved conversions by 4.9% and reduced bounce rates. See the full impact of this change!
+2.7%
Clickthrough rate
Repositioning the chat pop-up significantly improves conversion rates across devices
Discover how repositioning a chat pop-up led to a remarkable 44.5% increase in conversions. Learn from this simple yet effective optimization.
+44.5%
Conversion rate
Adding Return Policy Link on Product Pages Boosts Customer Trust and Conversion Rates
Adding a return policy link near Add to Cart on PDPs led to a -6.0% conversion rate drop, suggesting it introduced doubt at the purchase decision point.
-6.0%
Conversion rate
PDP Redesign Boosts Trust and Conversion Rates
Discover how a homepage and PDP redesign led to an 8.1% increase in conversions and enhanced user engagement. Explore the key changes made!
+8.1%
Conversion rate
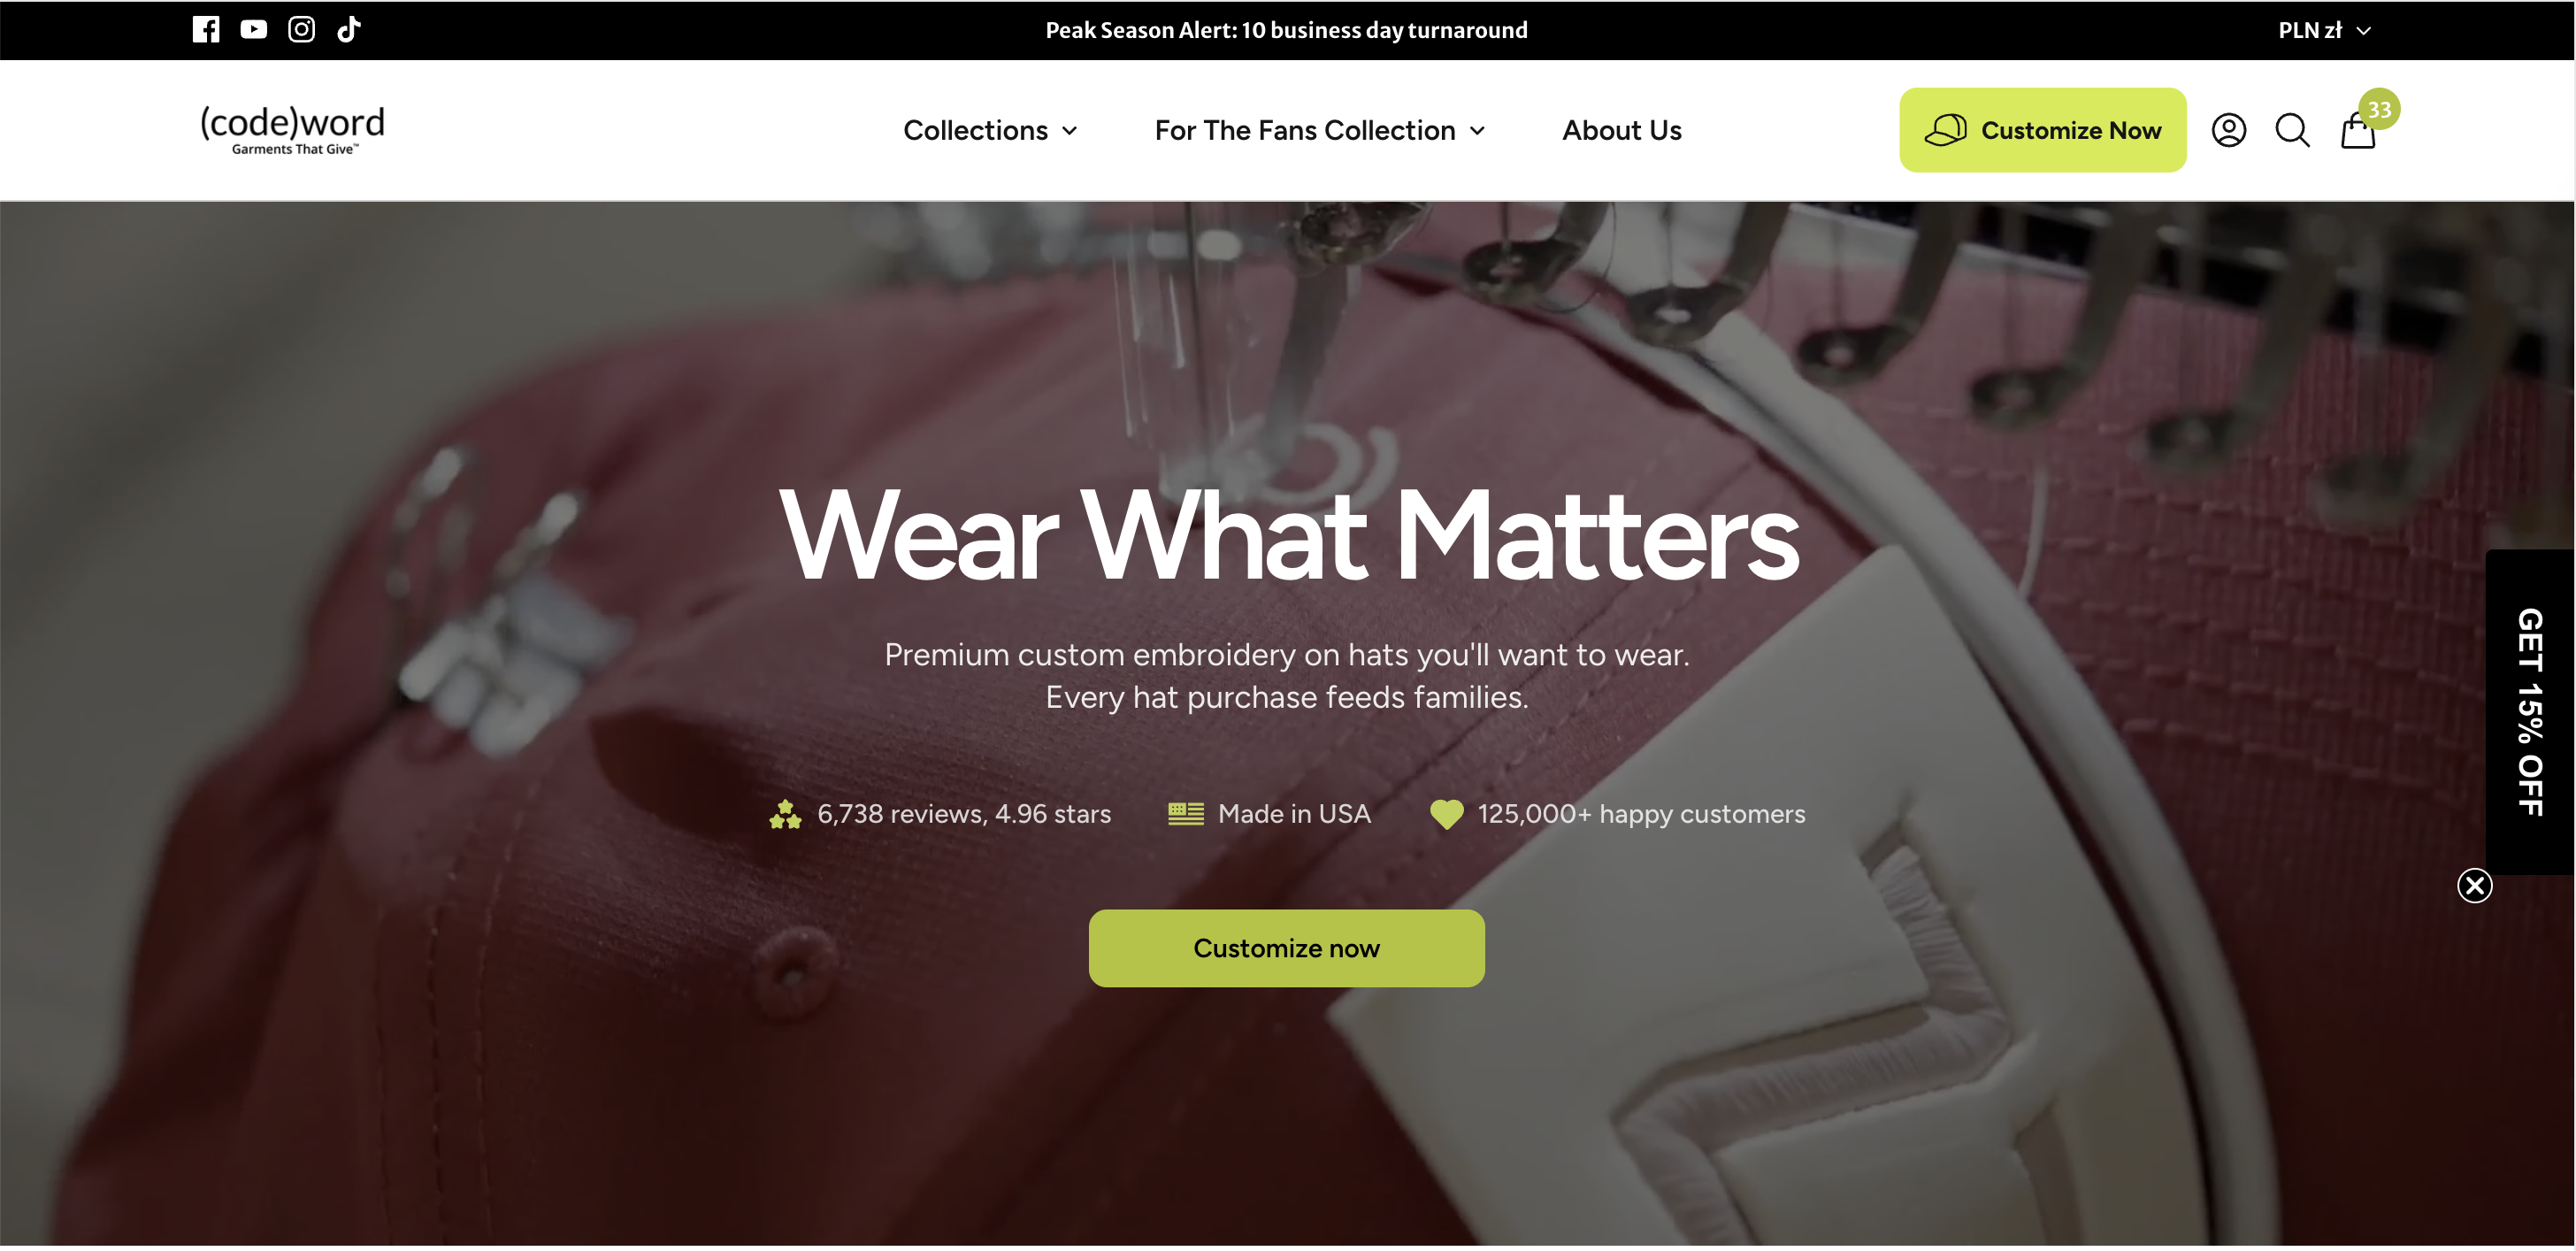
Homepage Hero Redesign Boosts Clarity and Conversion Rates
Discover how a homepage redesign enhanced clarity and trust, yielding an 11% conversion increase. Explore the key changes that made a difference!
+11.0%
Conversion rate
Streamlined mobile navigation
Discover how a homepage and PDP redesign led to a 19.2% increase in conversions and enhanced mobile user engagement. Explore the insights now!
+19.2%
Conversion rate
Enhanced Navigation Clarity with Breadcrumbs on Collection Pages
Discover how adding breadcrumbs to collection pages enhanced navigation, reducing bounce rates and increasing engagement by 1.8%. Explore the results!
+1.8%
Conversion rate
Adding "New" badges across product listings
Elevate engagement with a simple "New" badge! Discover how this small change led to a +40.4% lift in conversions on desktop. Explore the results!
+1.8%
Clickthrough rate
Homepage Recommendations Layout Redesign
Explore how a redesigned homepage layout for product recommendations increased engagement by 3.4%. Discover effective strategies for your brand!
+1.5%
Clickthrough rate
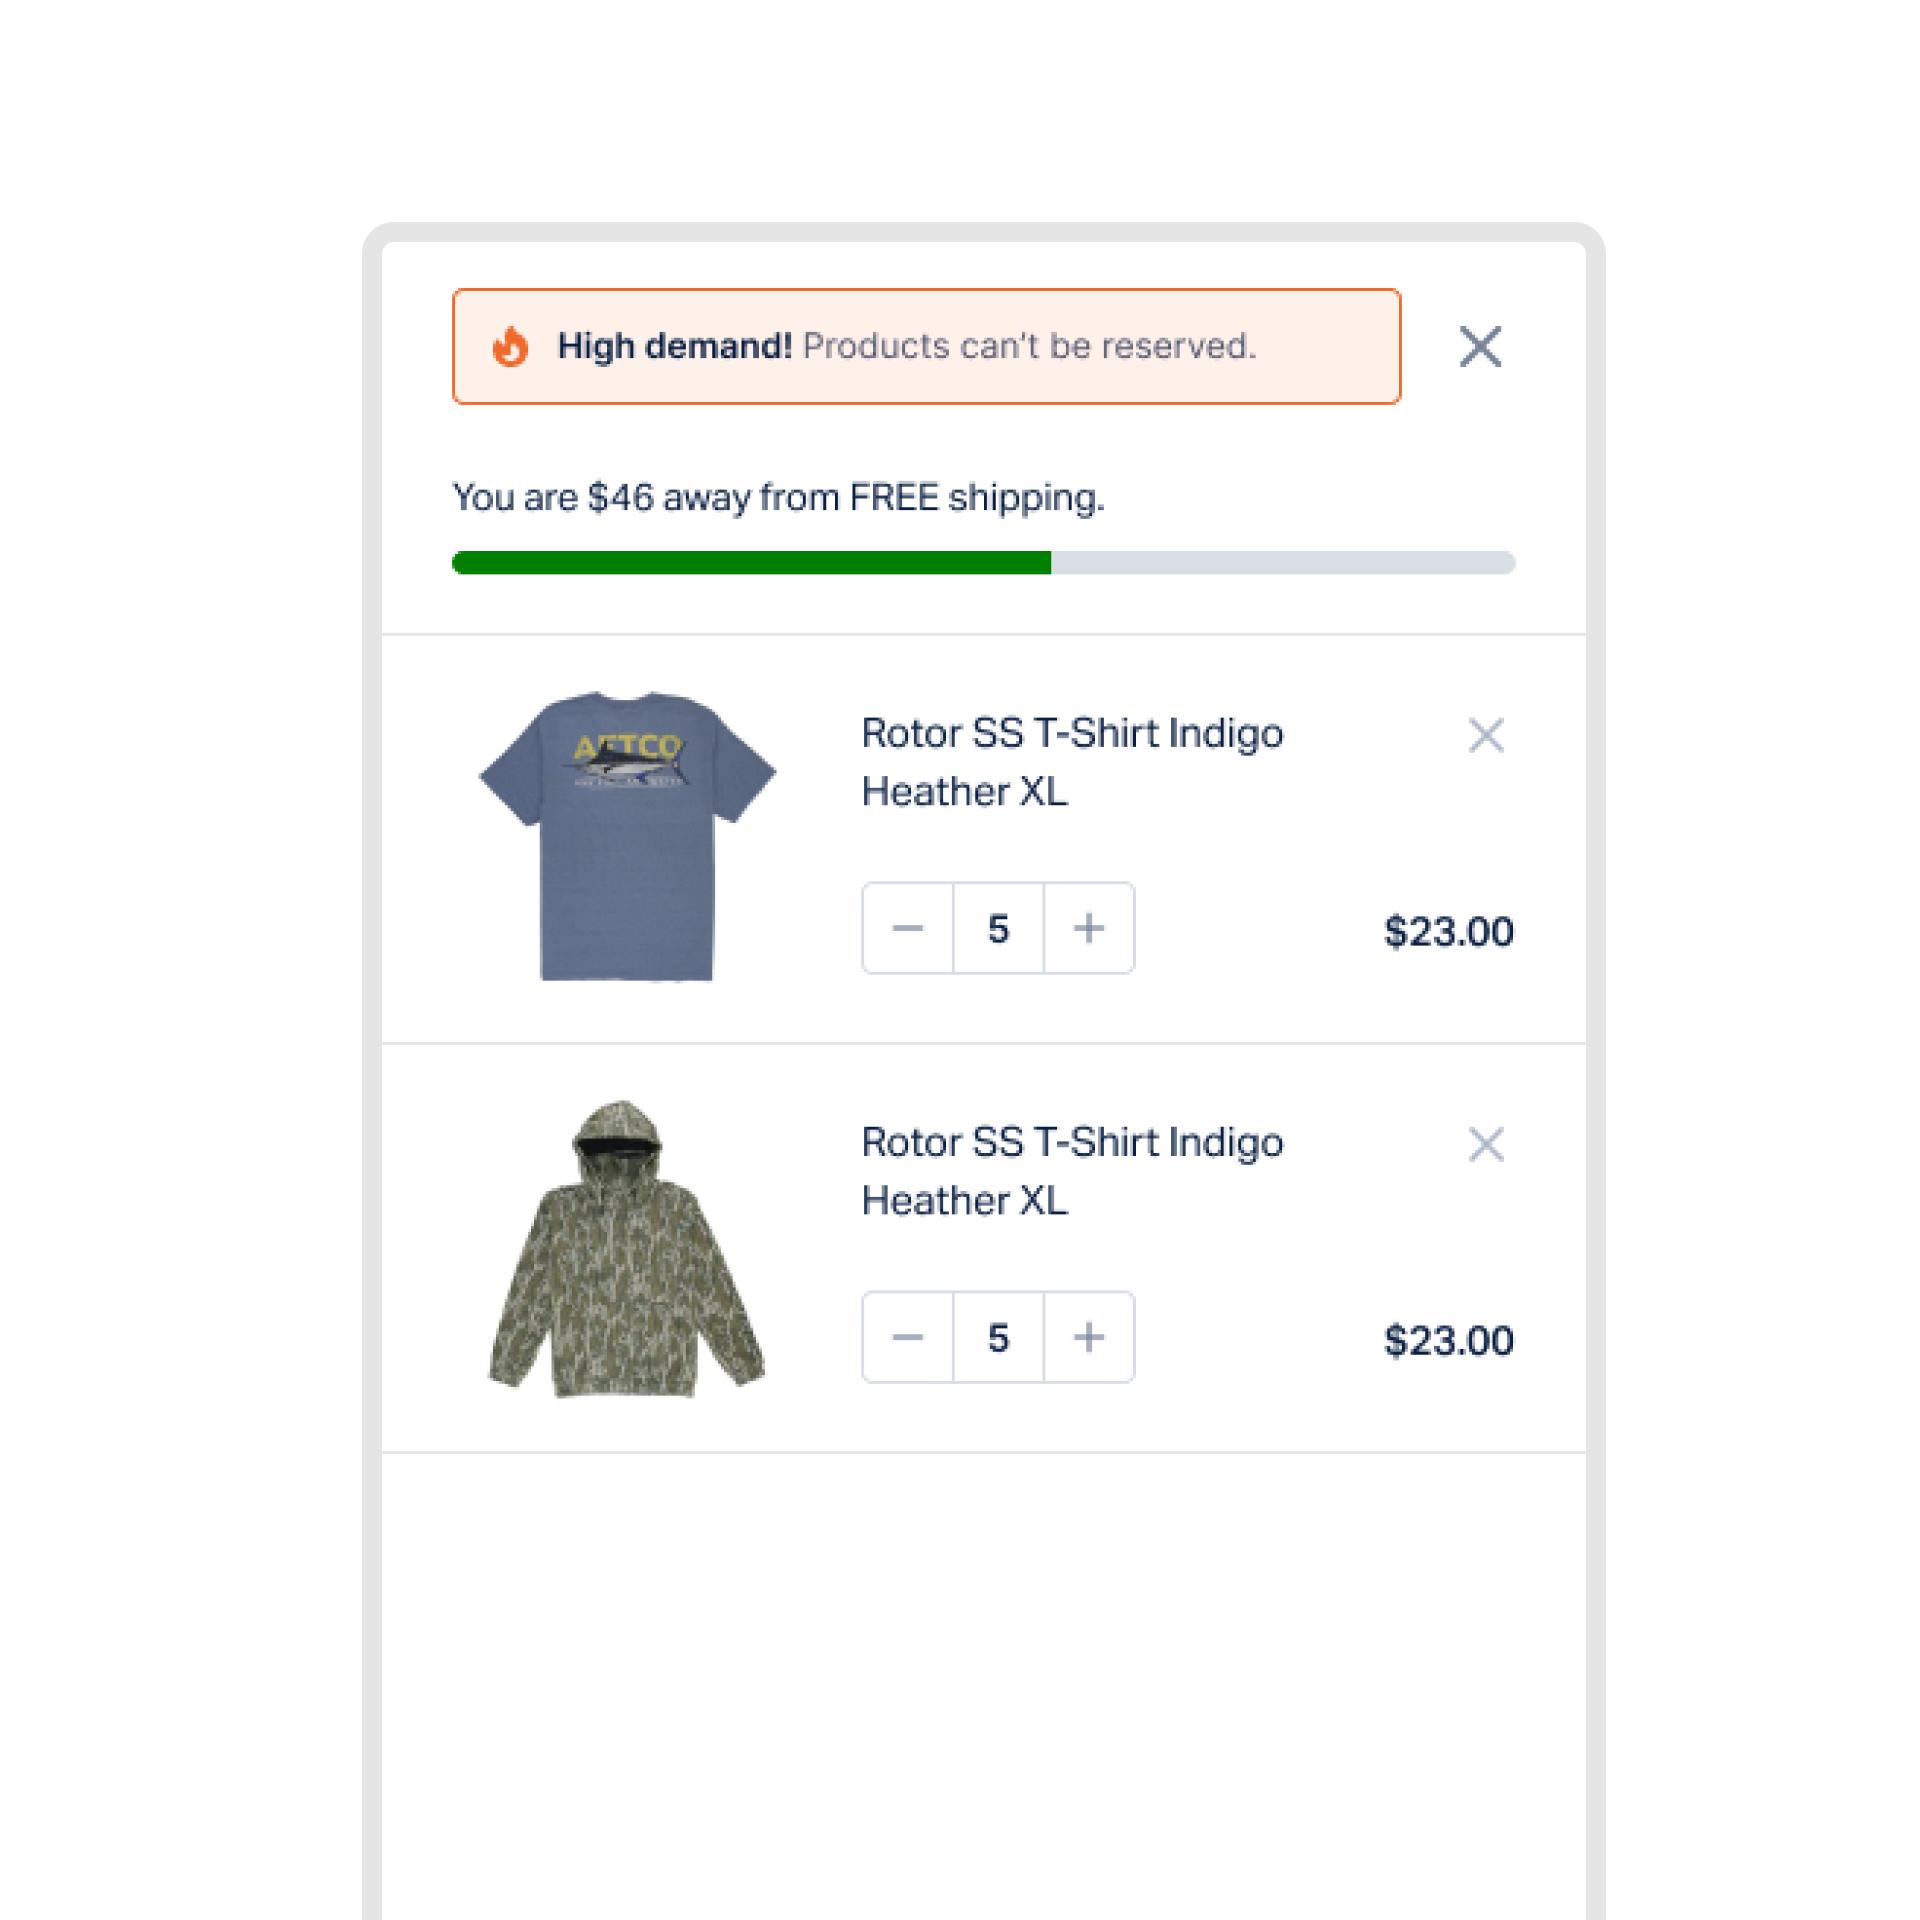
Visual free shipping progress indicator
Discover how a free shipping indicator in the minicart can lead to a 9.2% increase in average order value. Explore the experiment details now!
-5.9%
Conversion rate
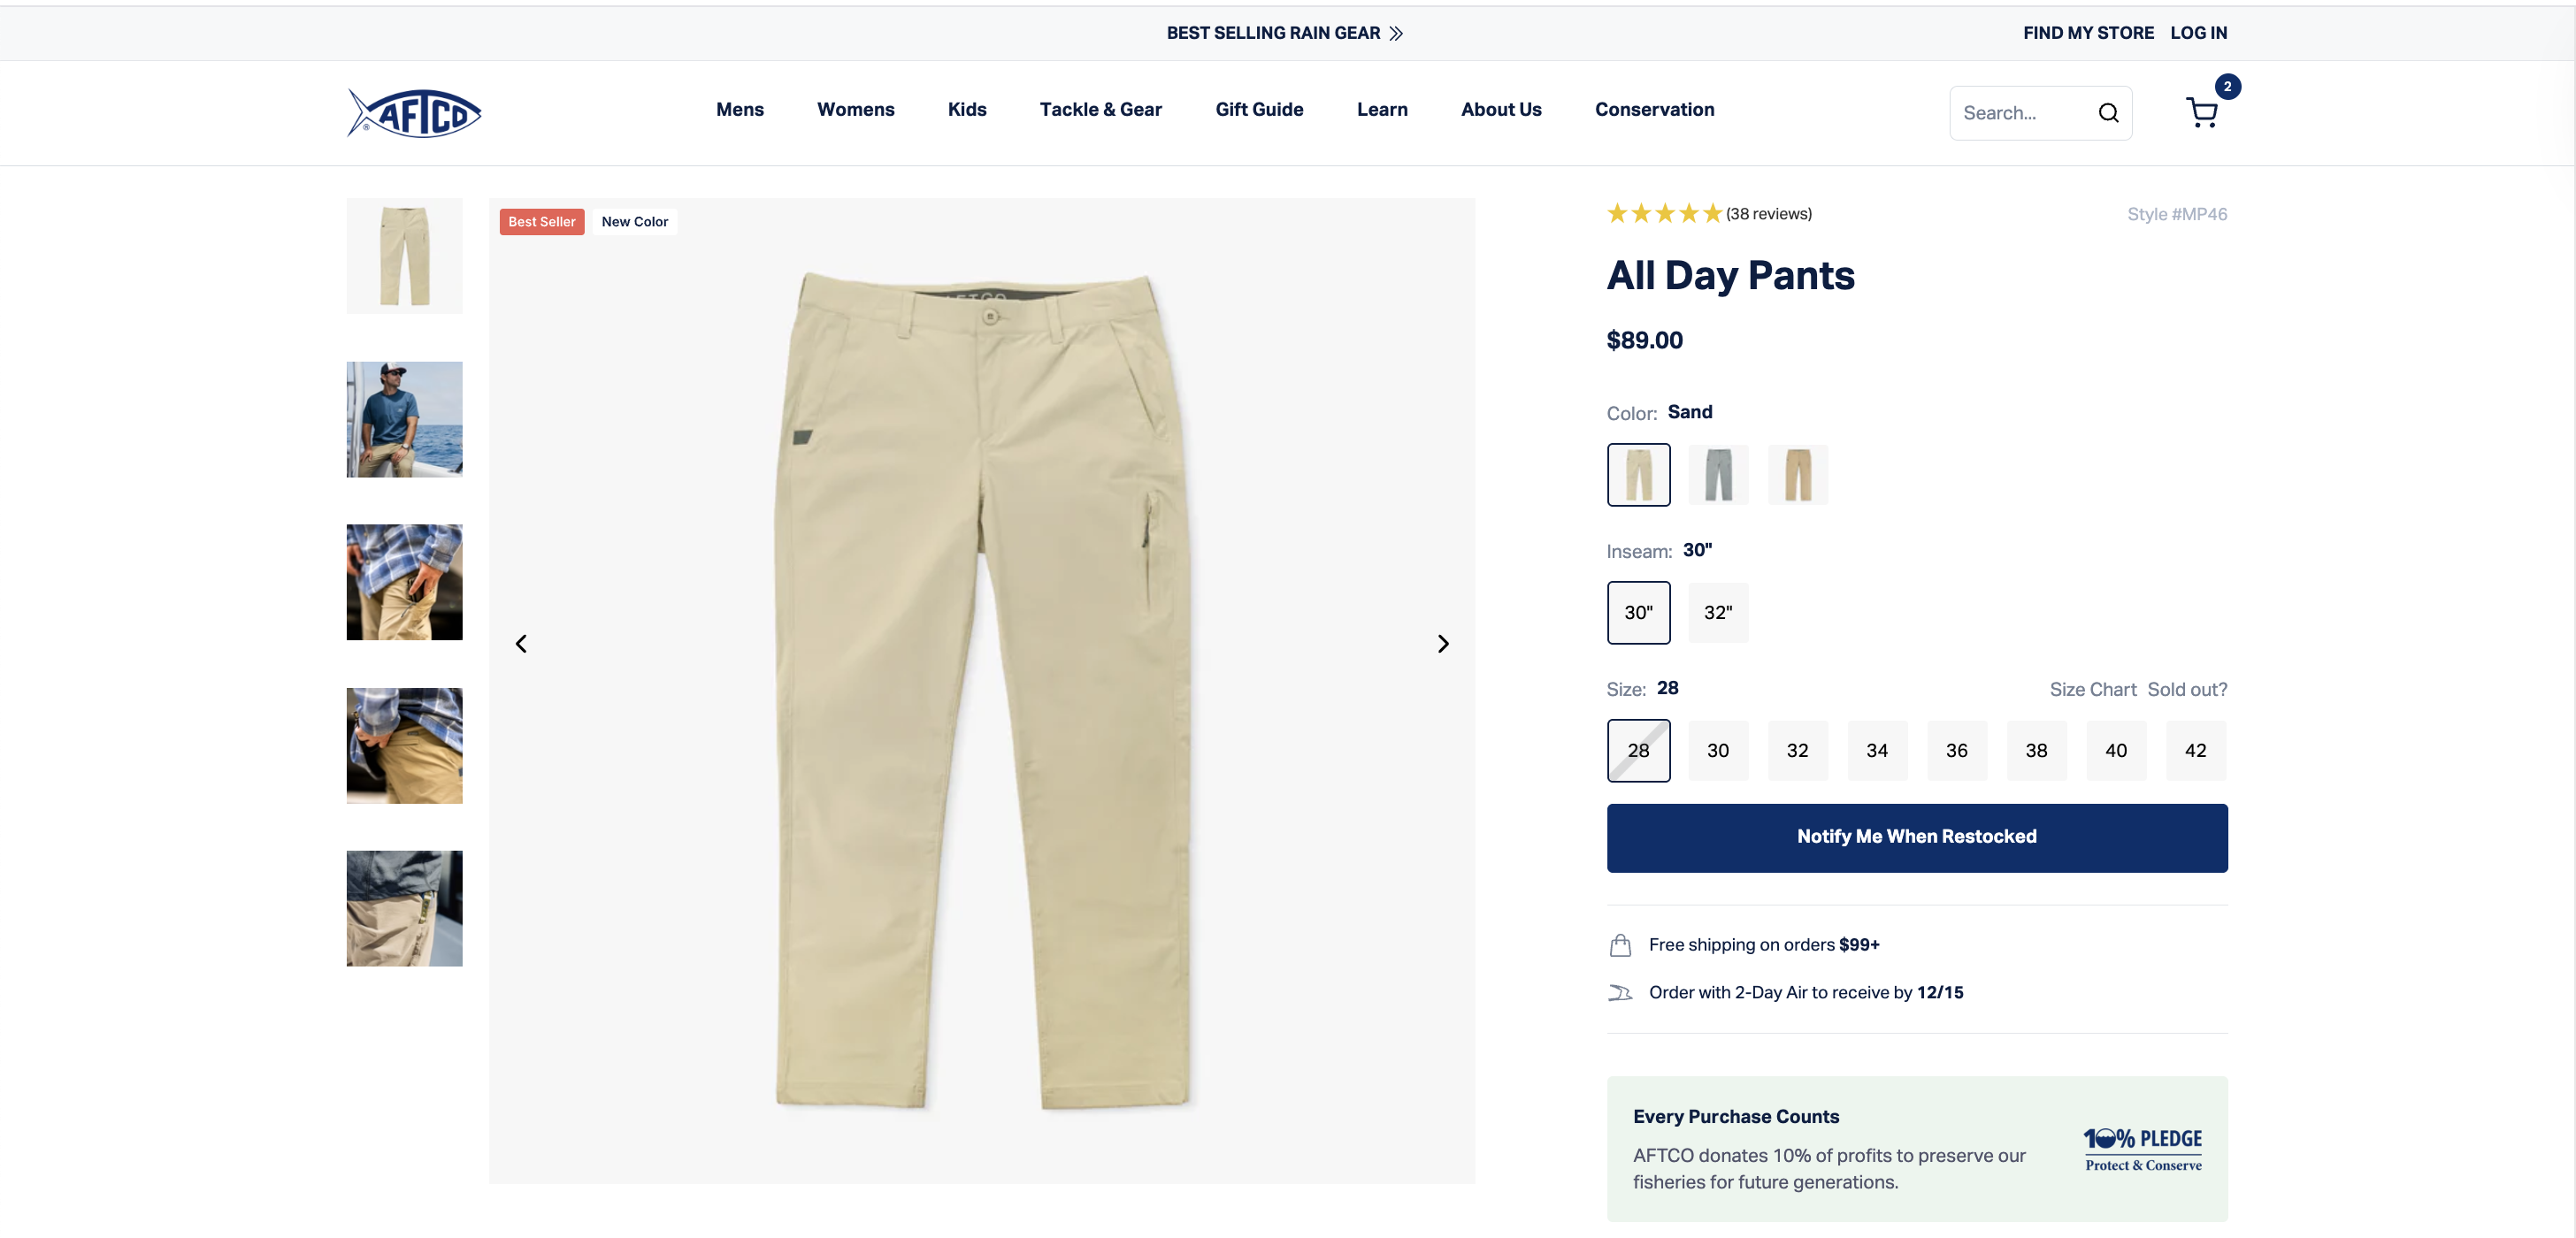
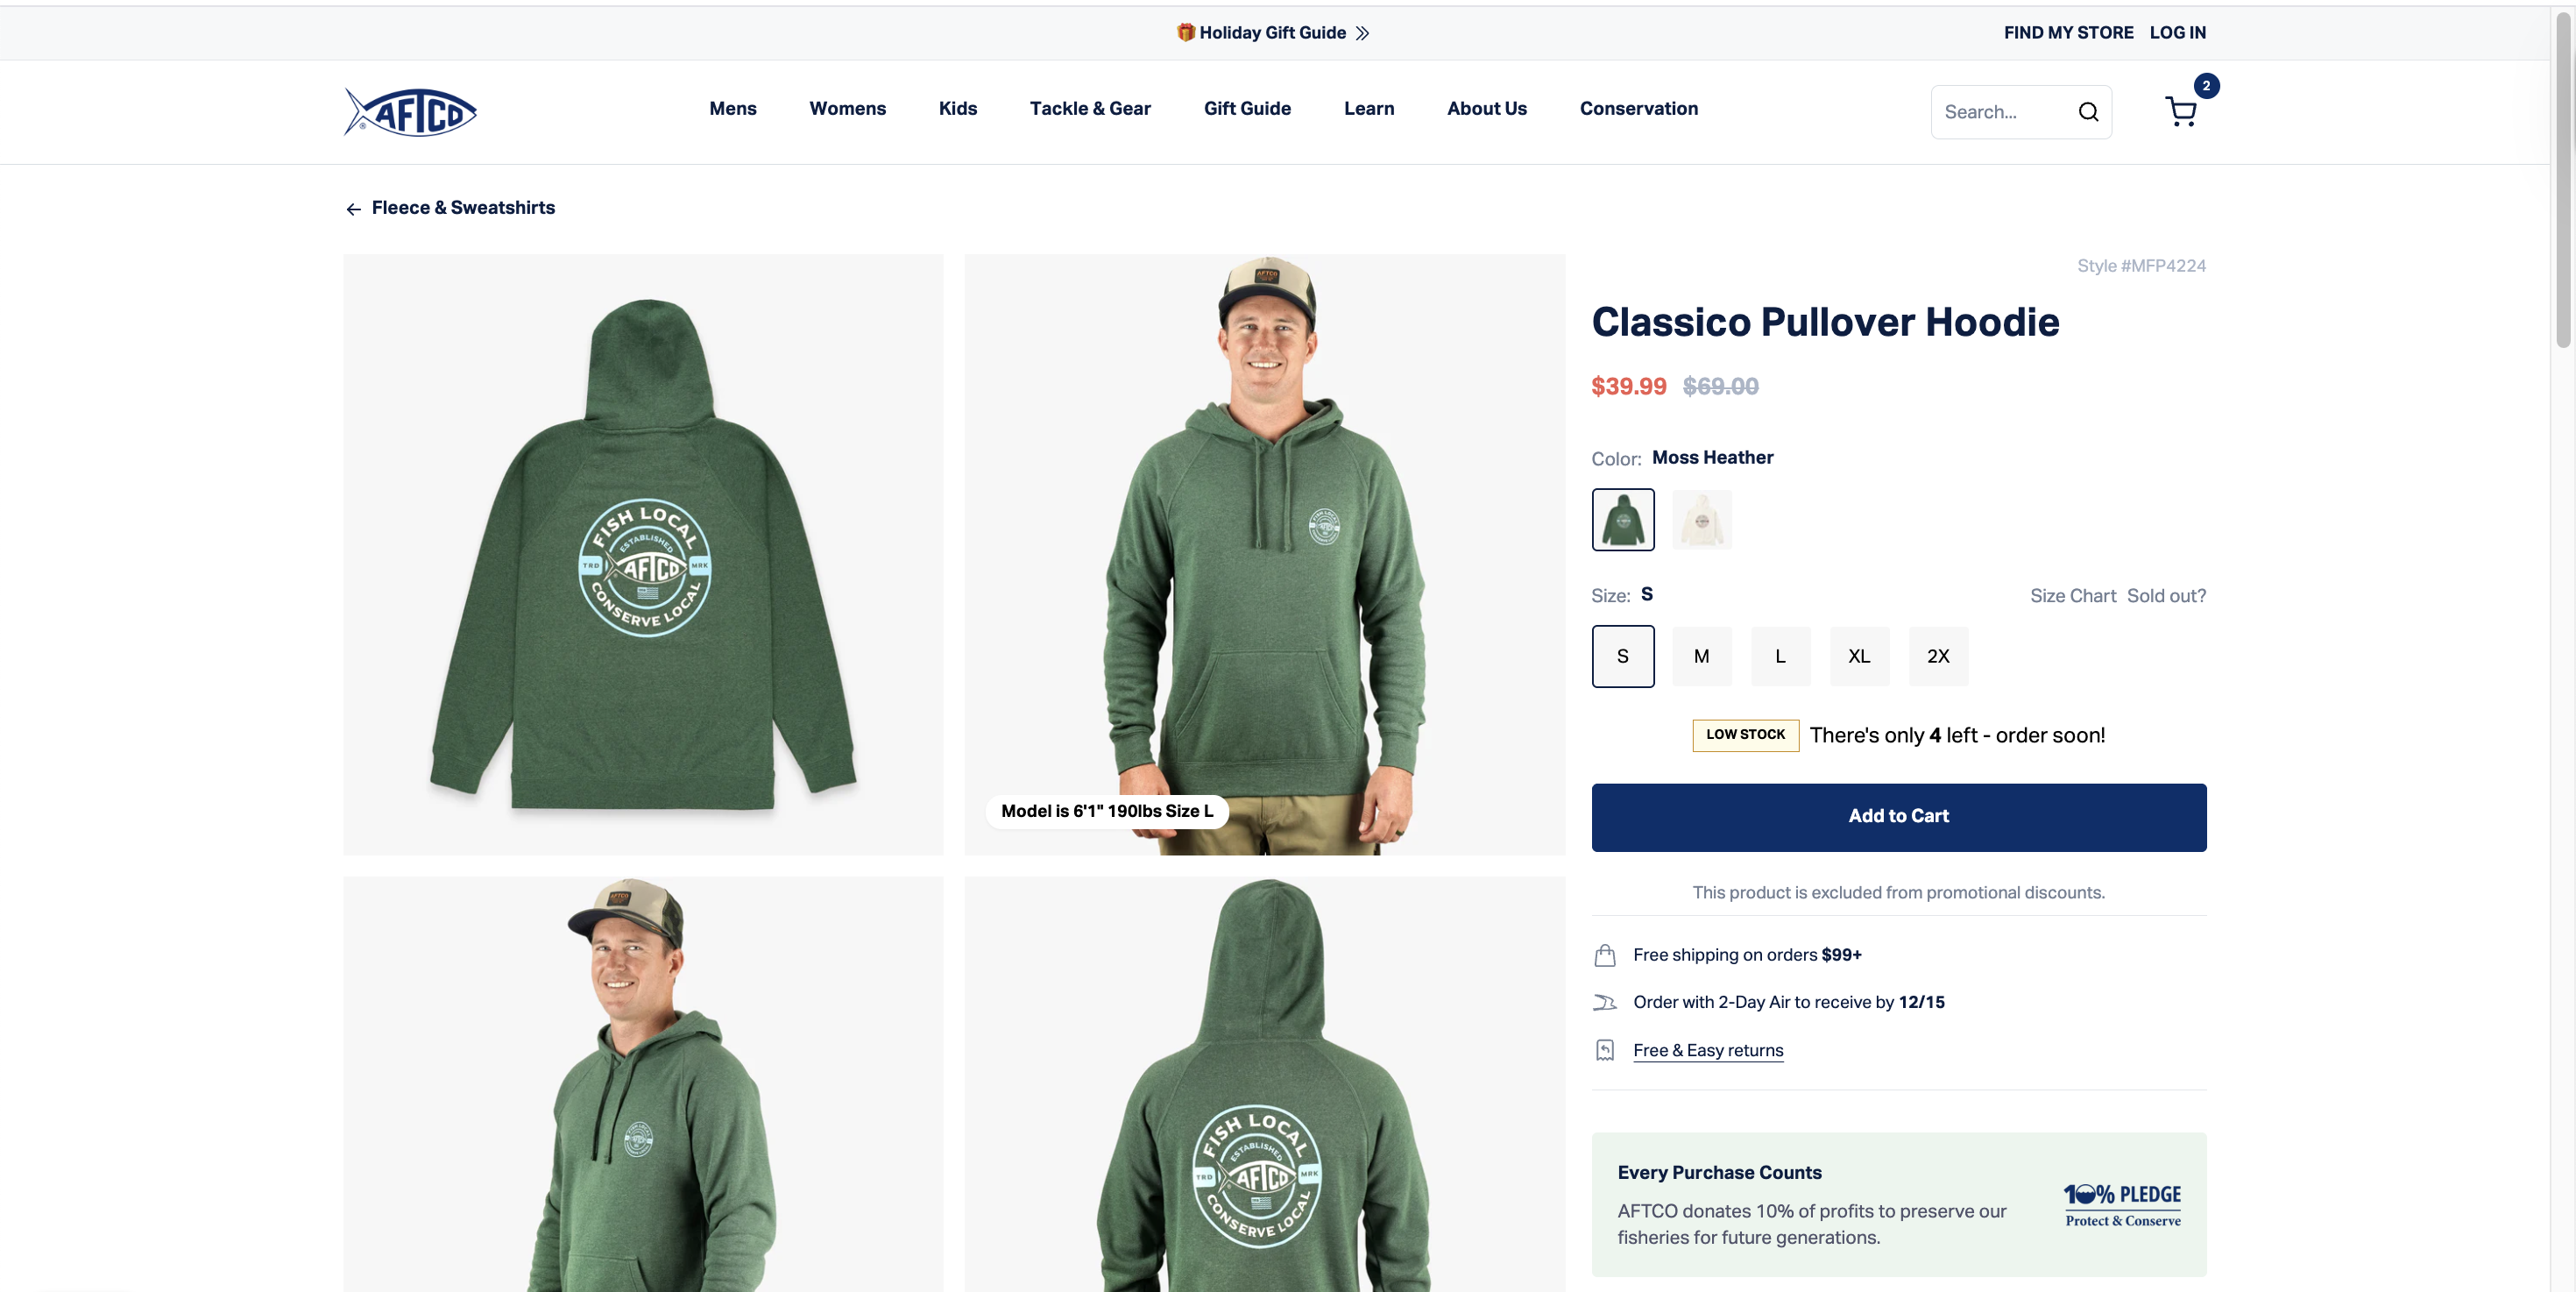
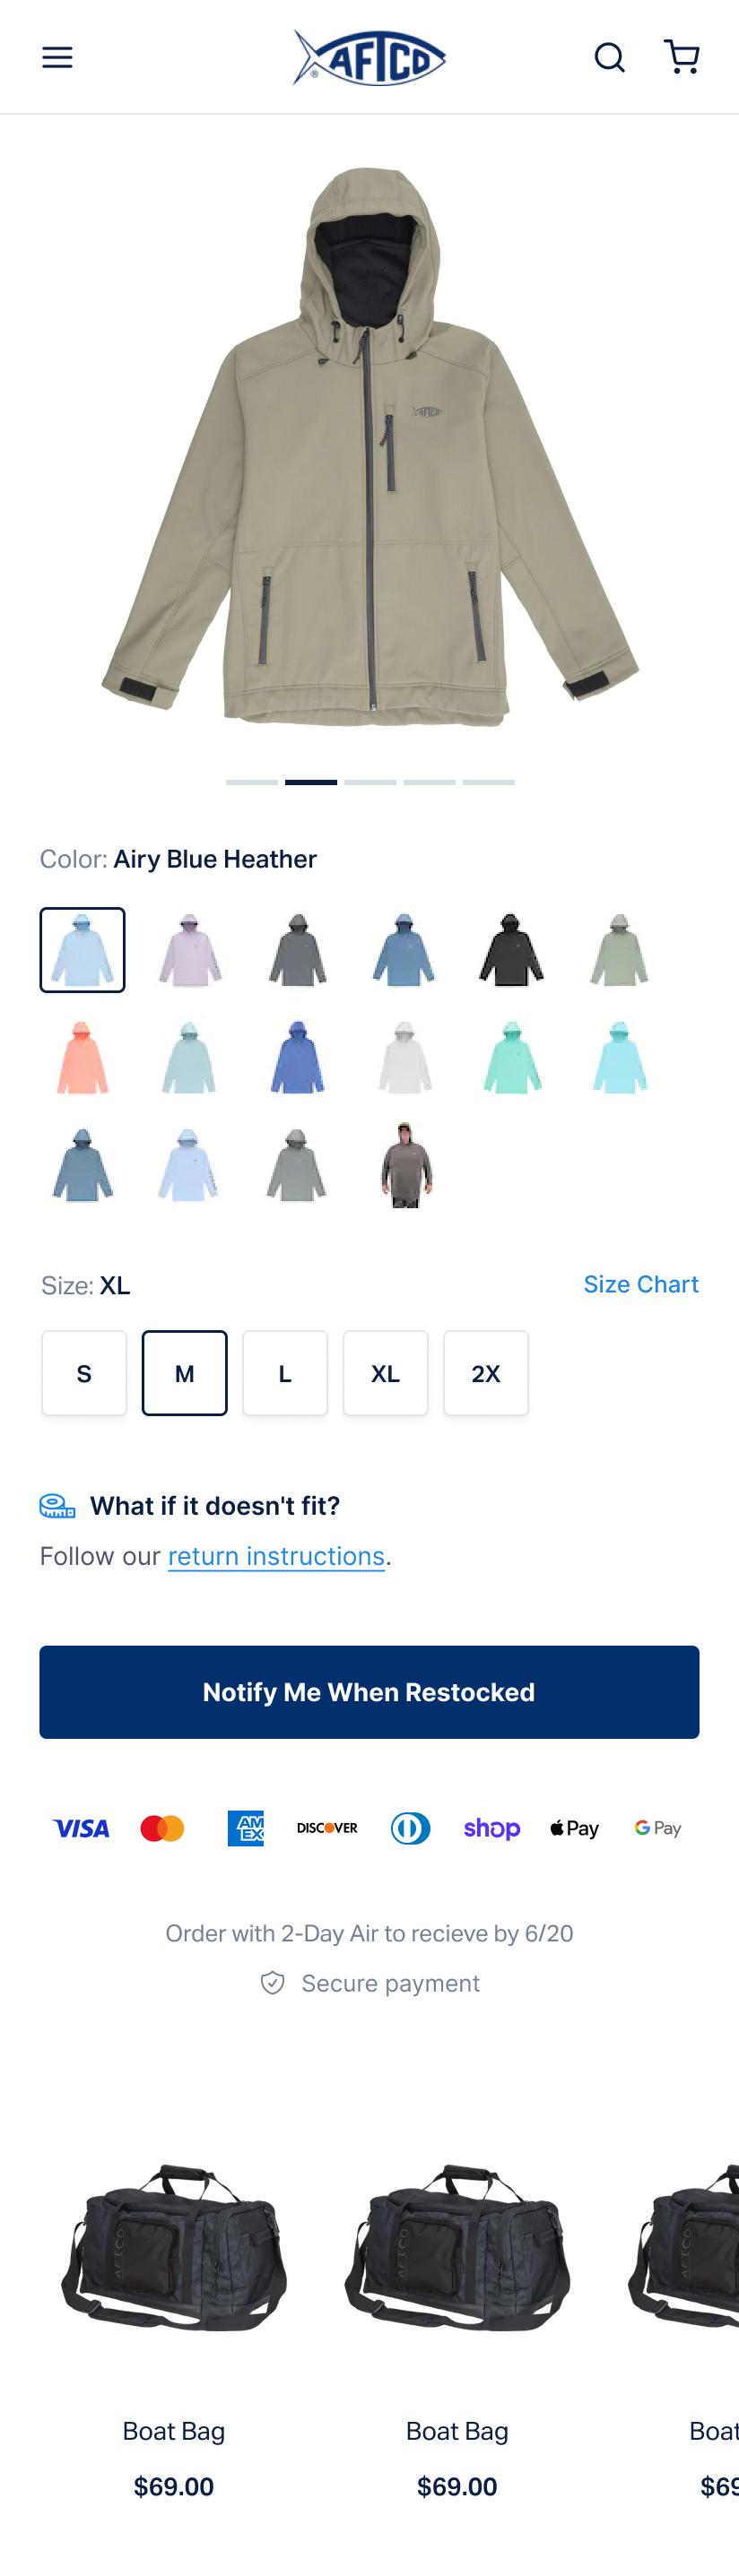
Highlighting AFTCO’s conservation pledge
Explore how conservation-focused messaging enhanced customer engagement and lifted conversion rates in this compelling A/B test.
+5.0%
Revenue per visitor (RPV)
Implementing a Sticky Navbar
Discover how a sticky navigation bar enhanced user engagement and led to a 15.3% increase in conversion rates. Explore the details now!
+0.5%
Clickthrough rate
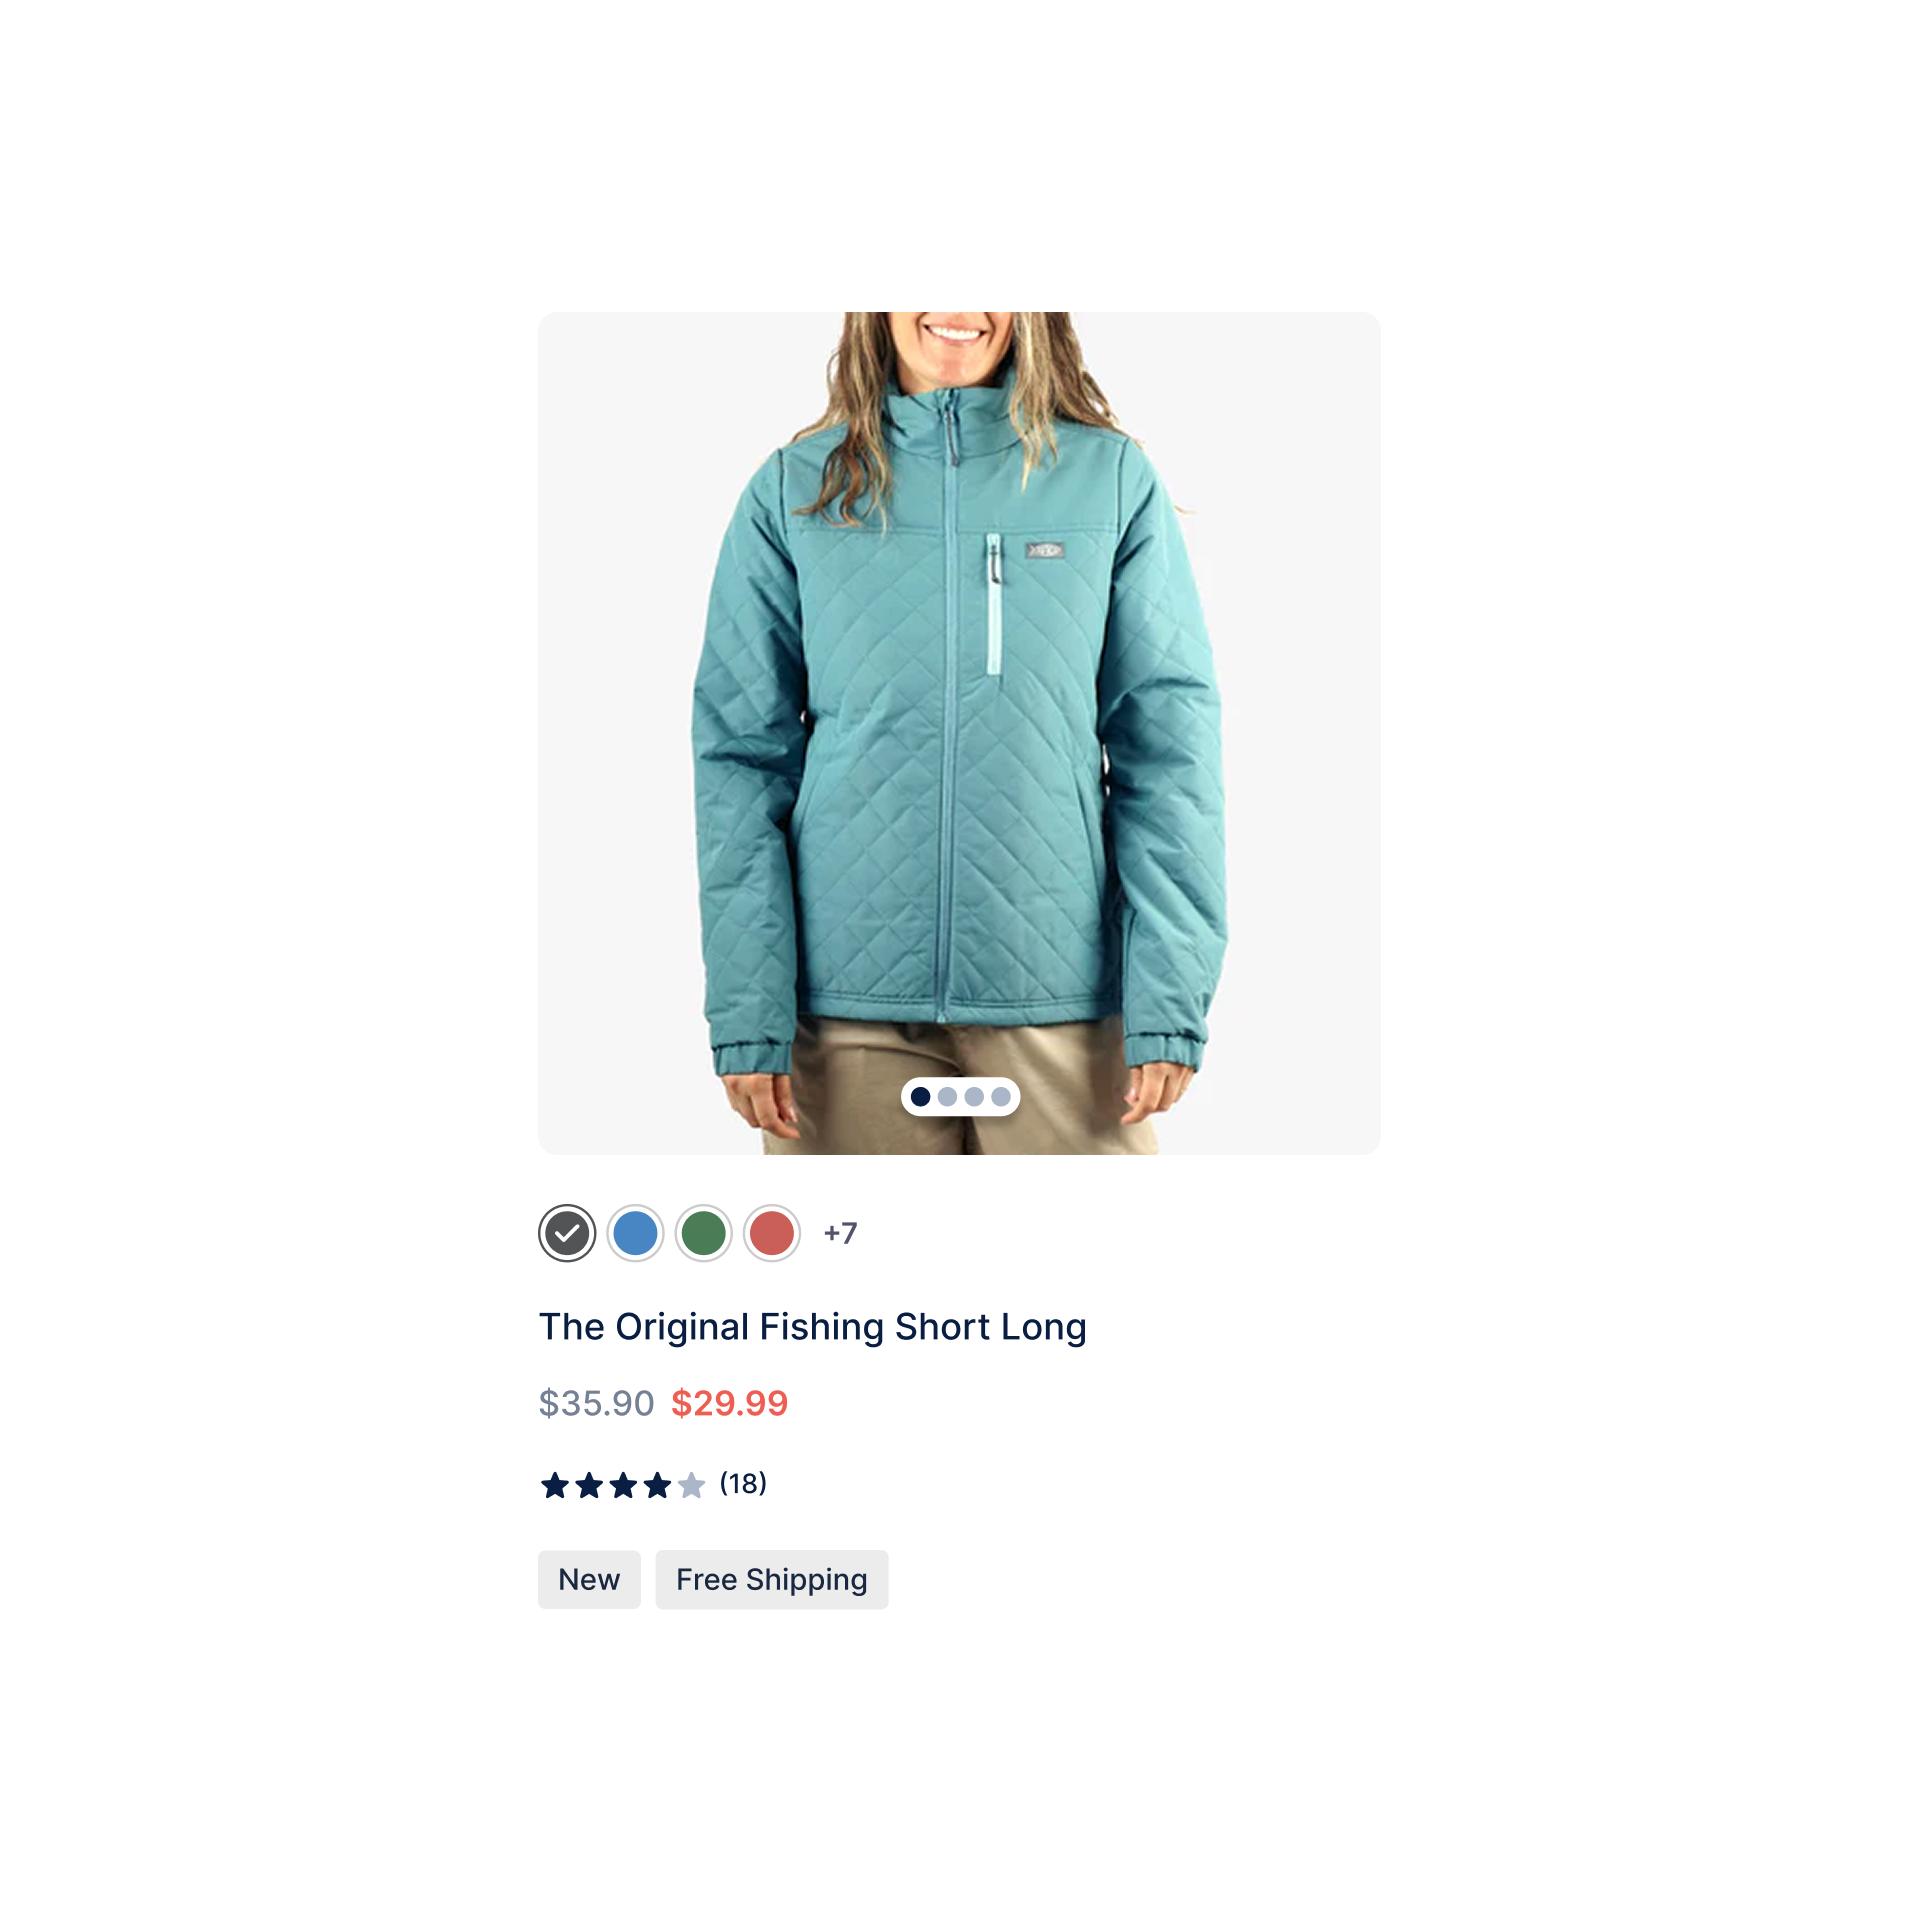
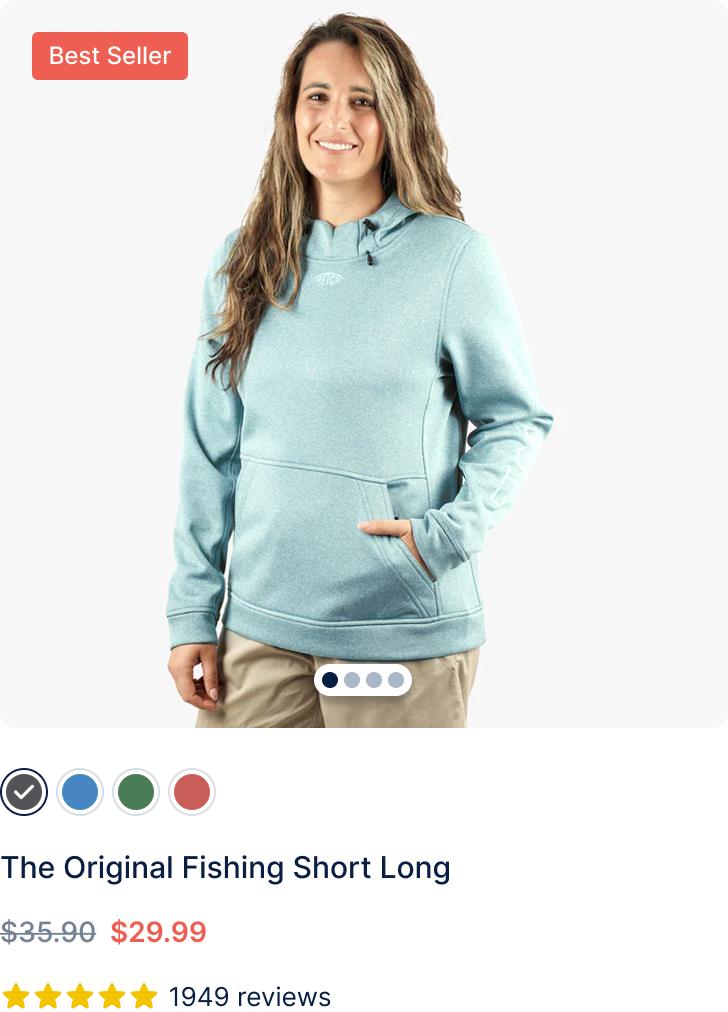
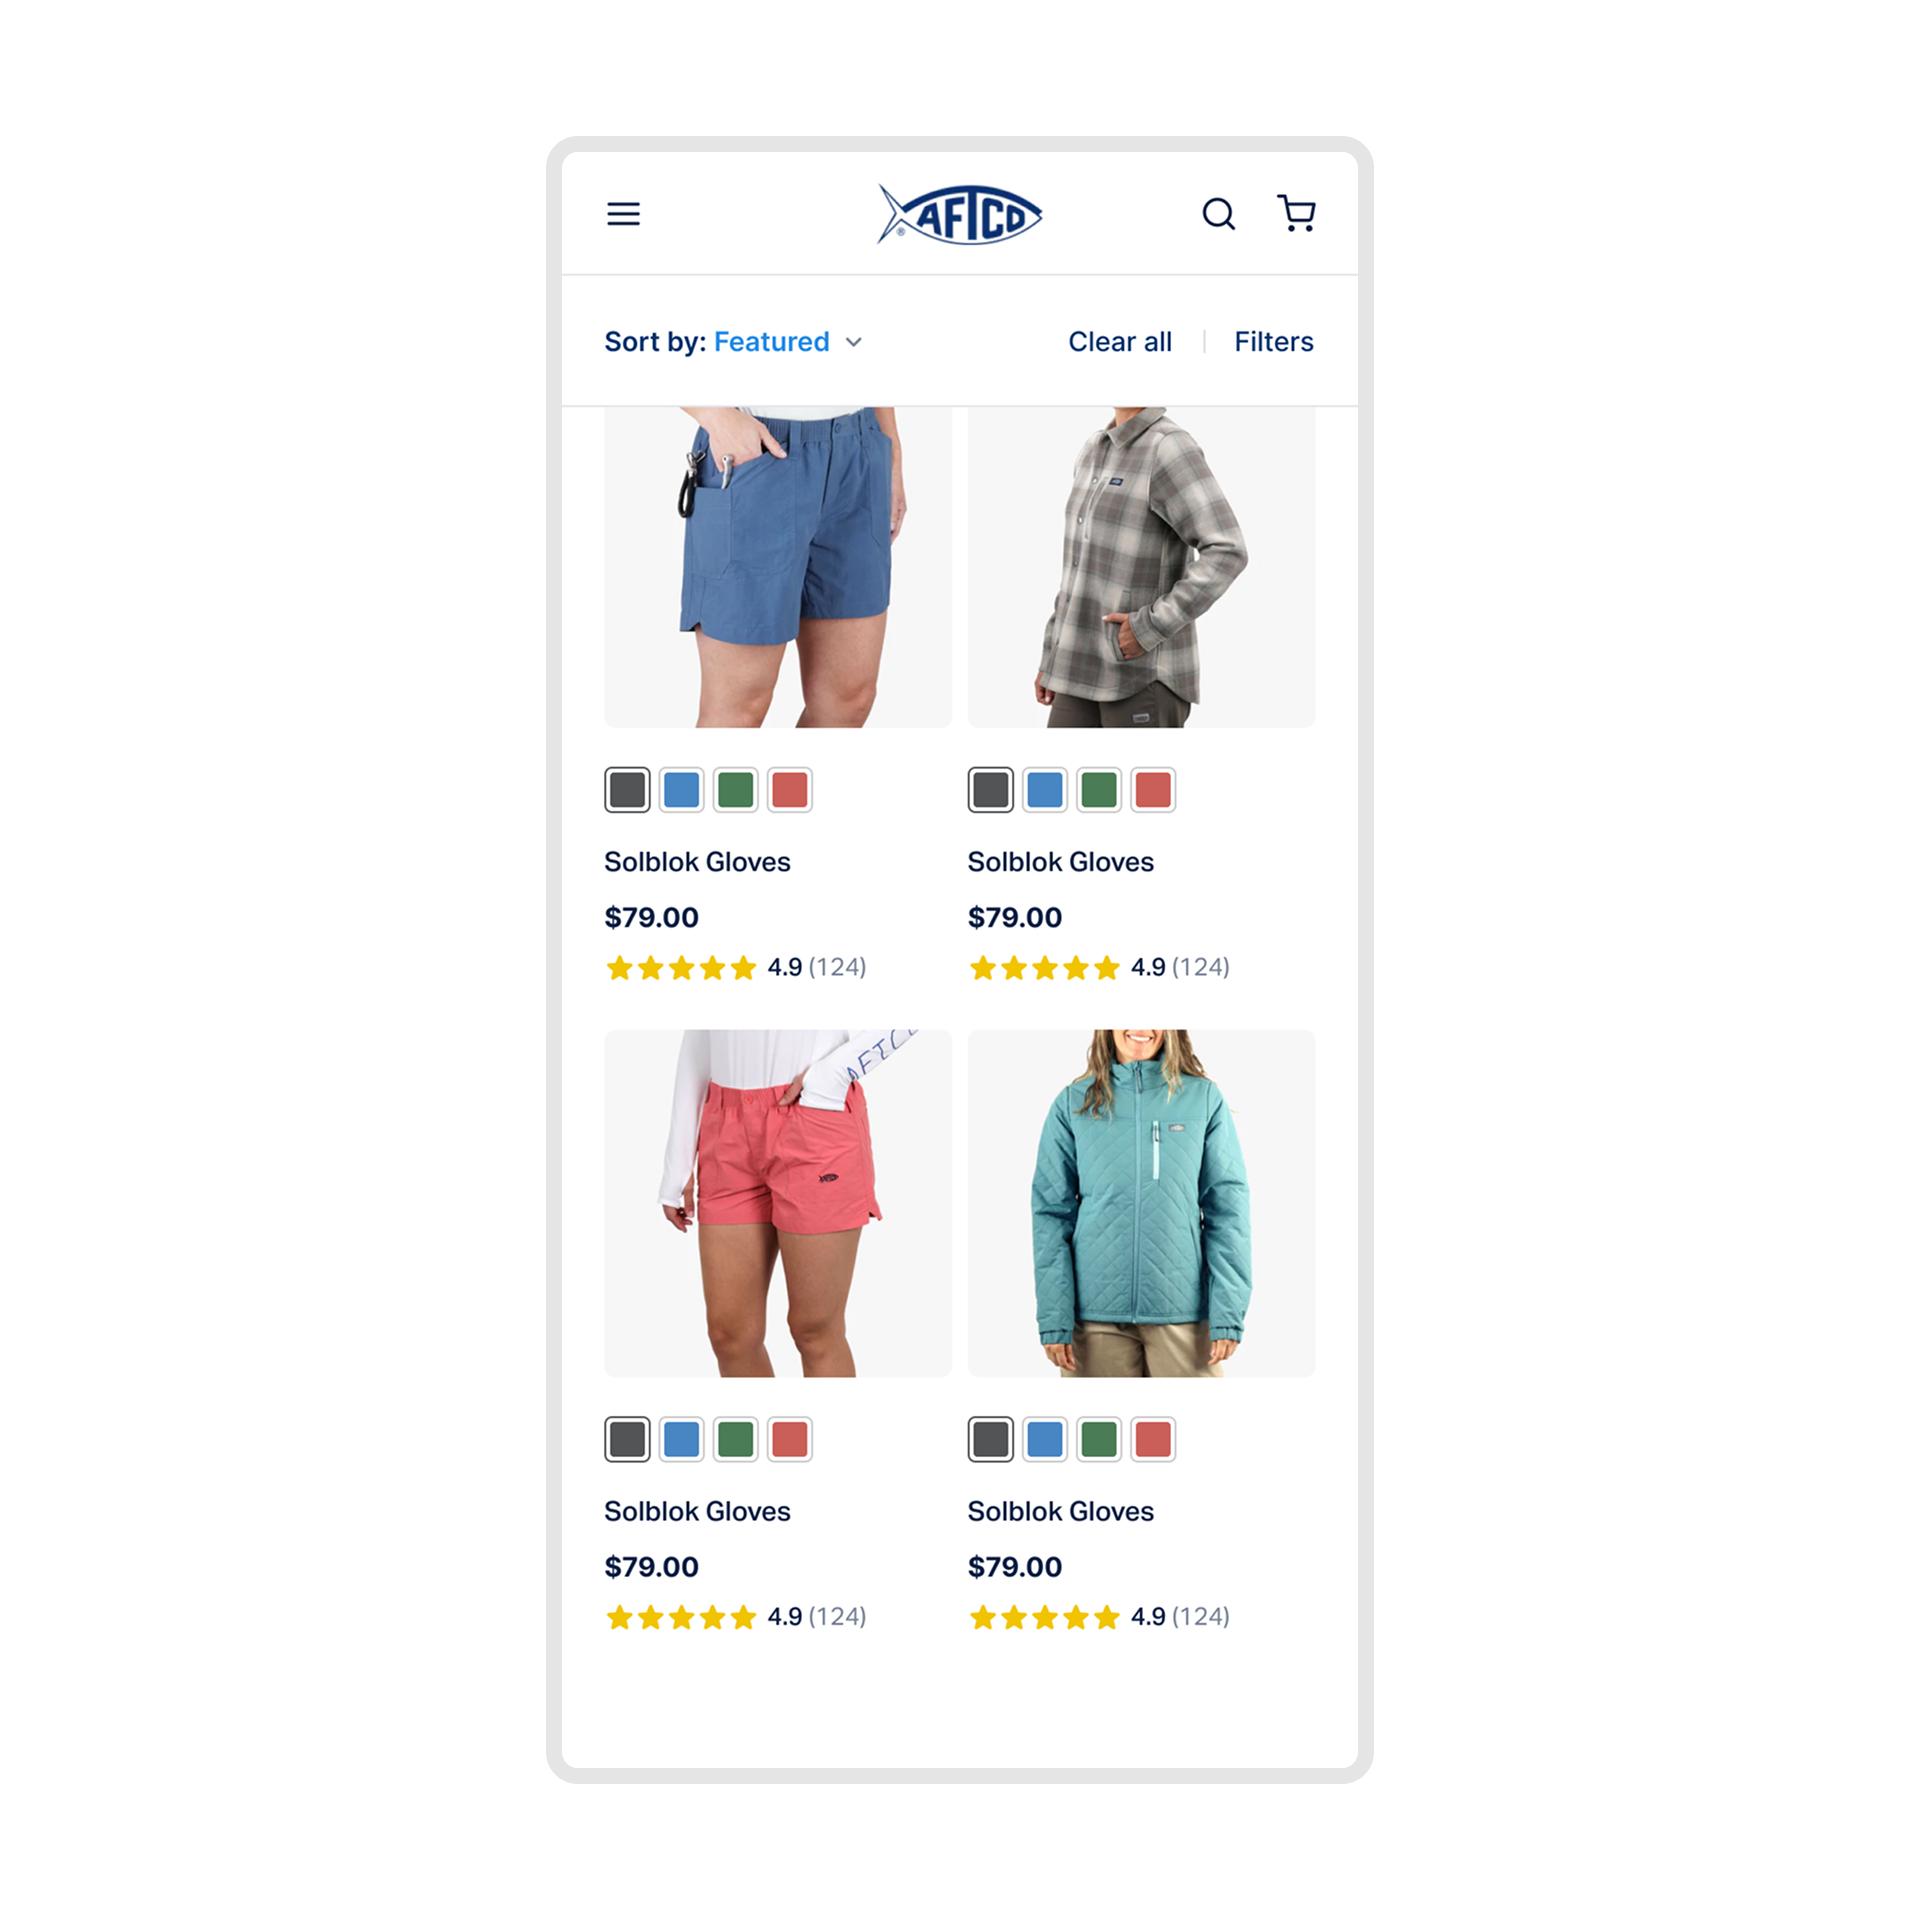
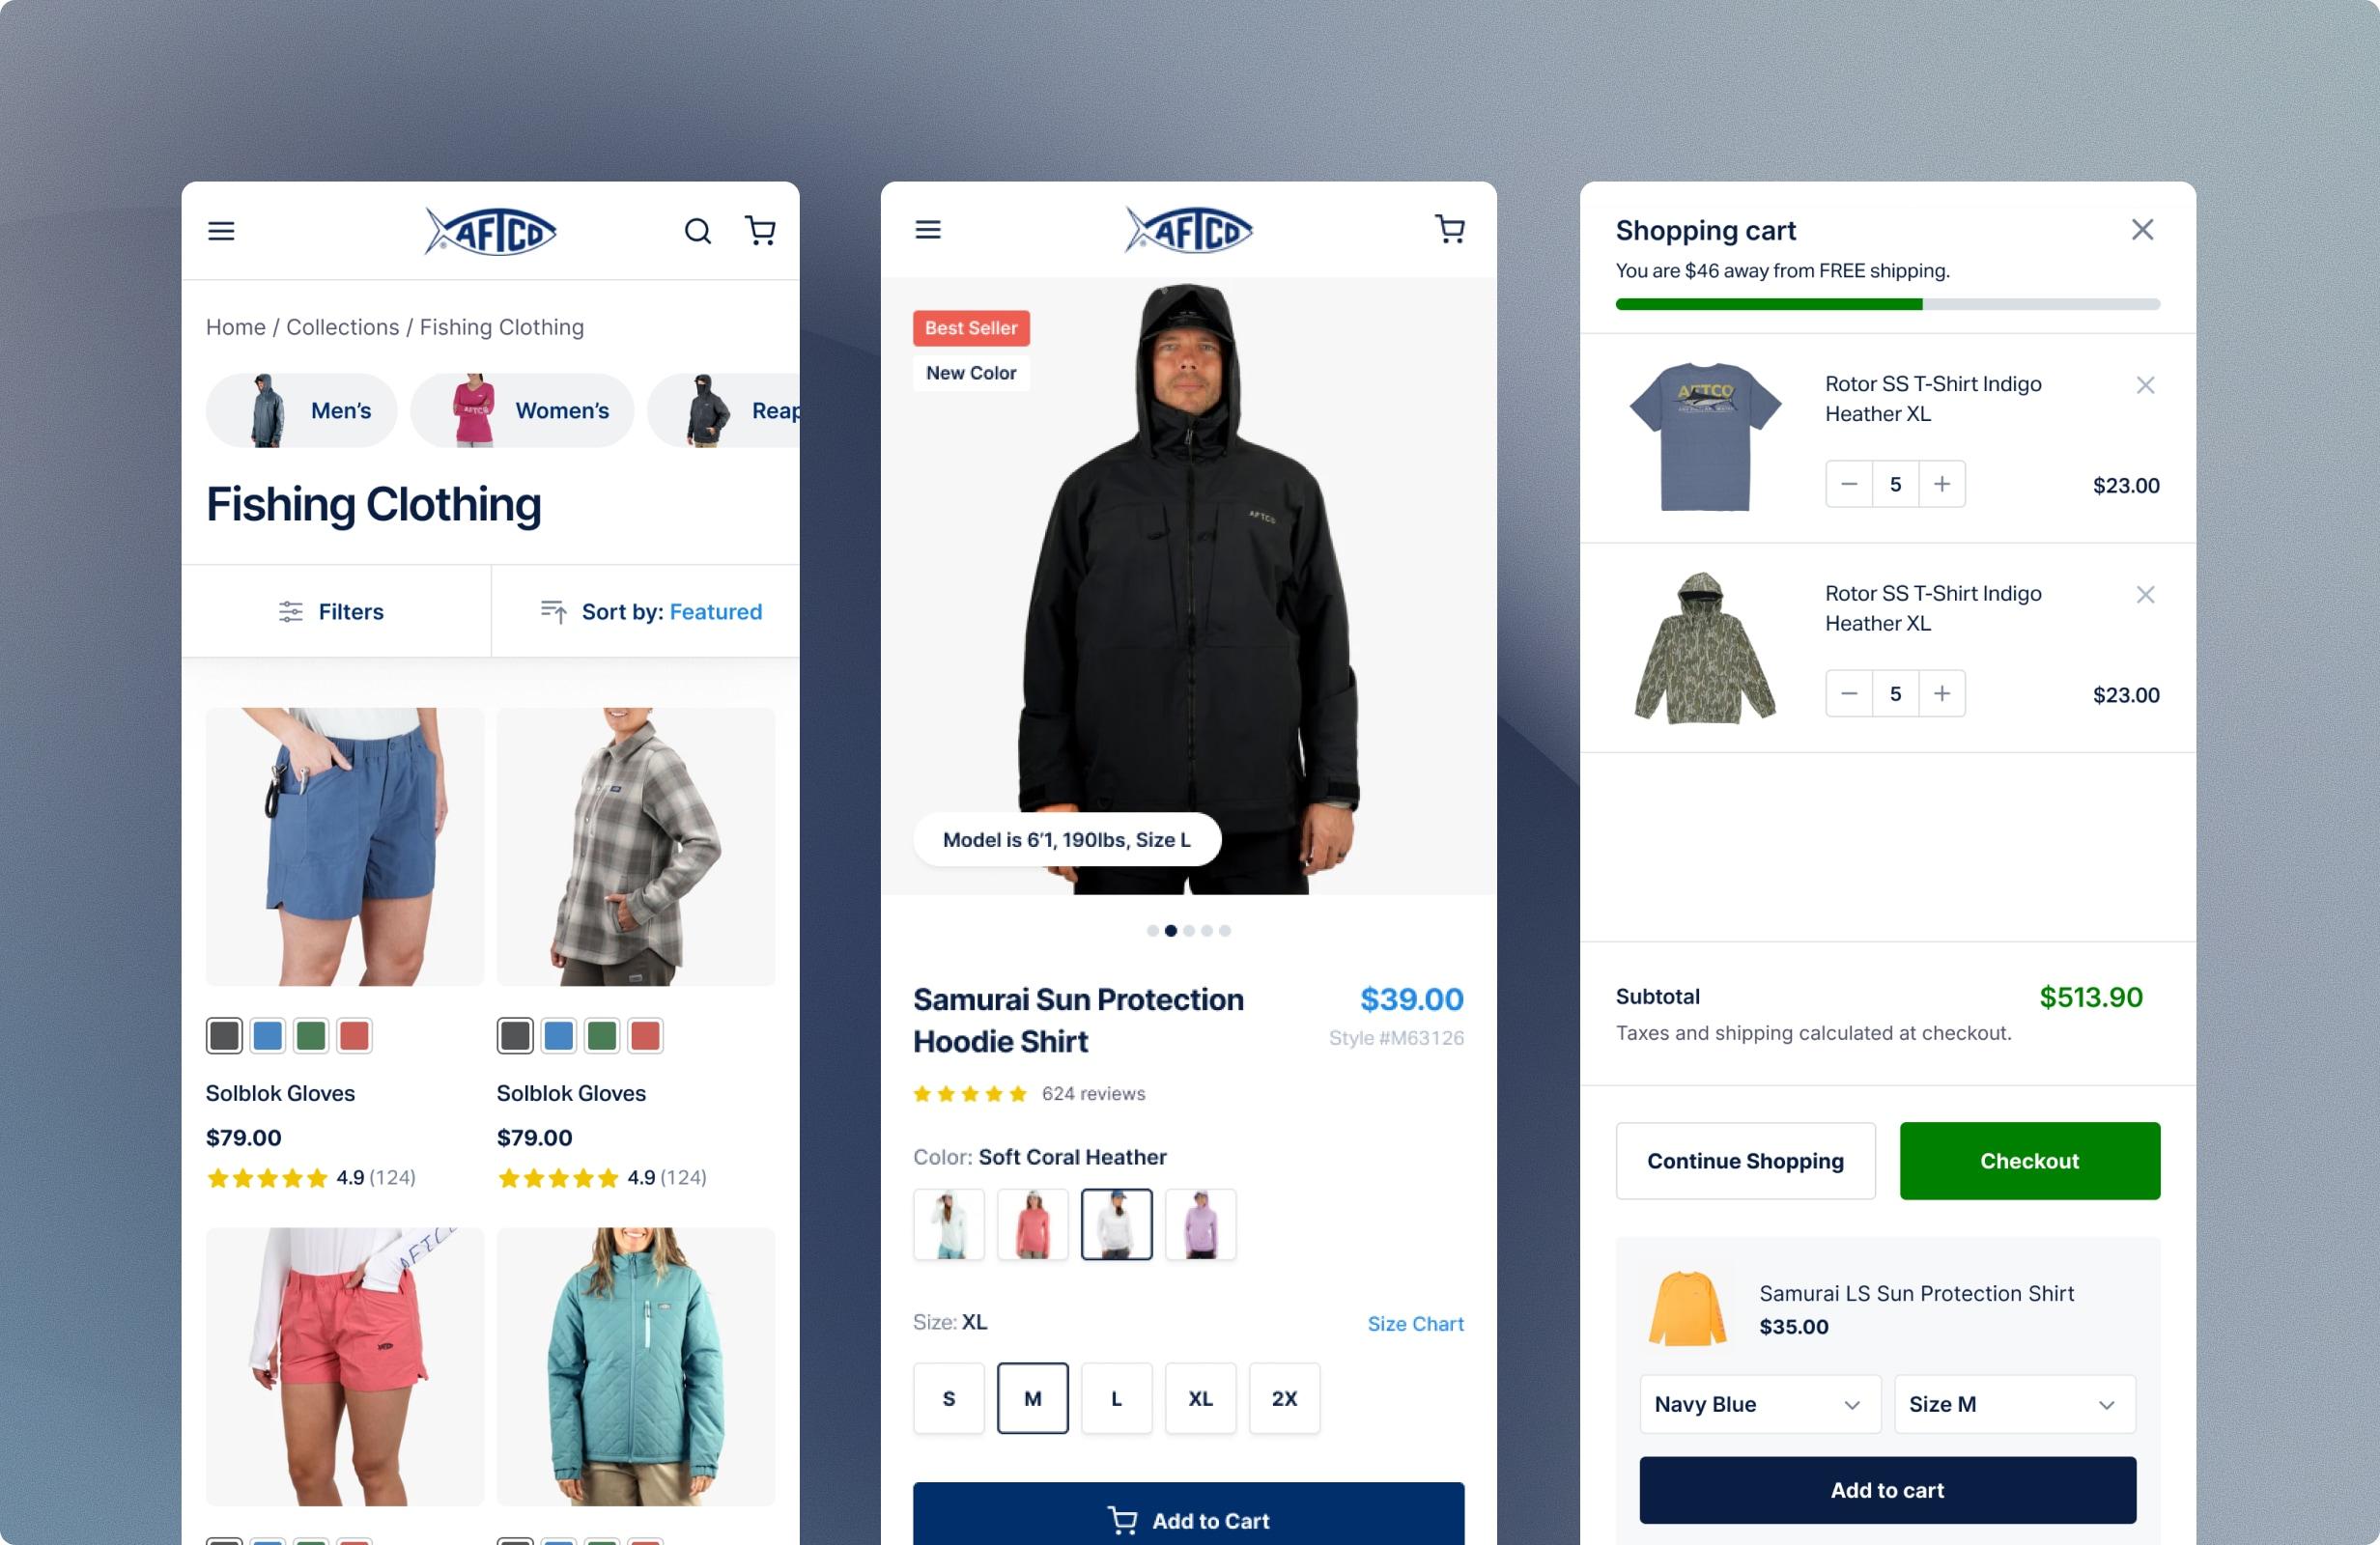
Enhanced Product Cards Drive User Engagement and Conversion Improvements
Discover how AFTCO's redesigned product cards increased mobile conversion rates by 3.6% and click-through rates by 5.5%. Explore the details!
+0.6%
Conversion rate
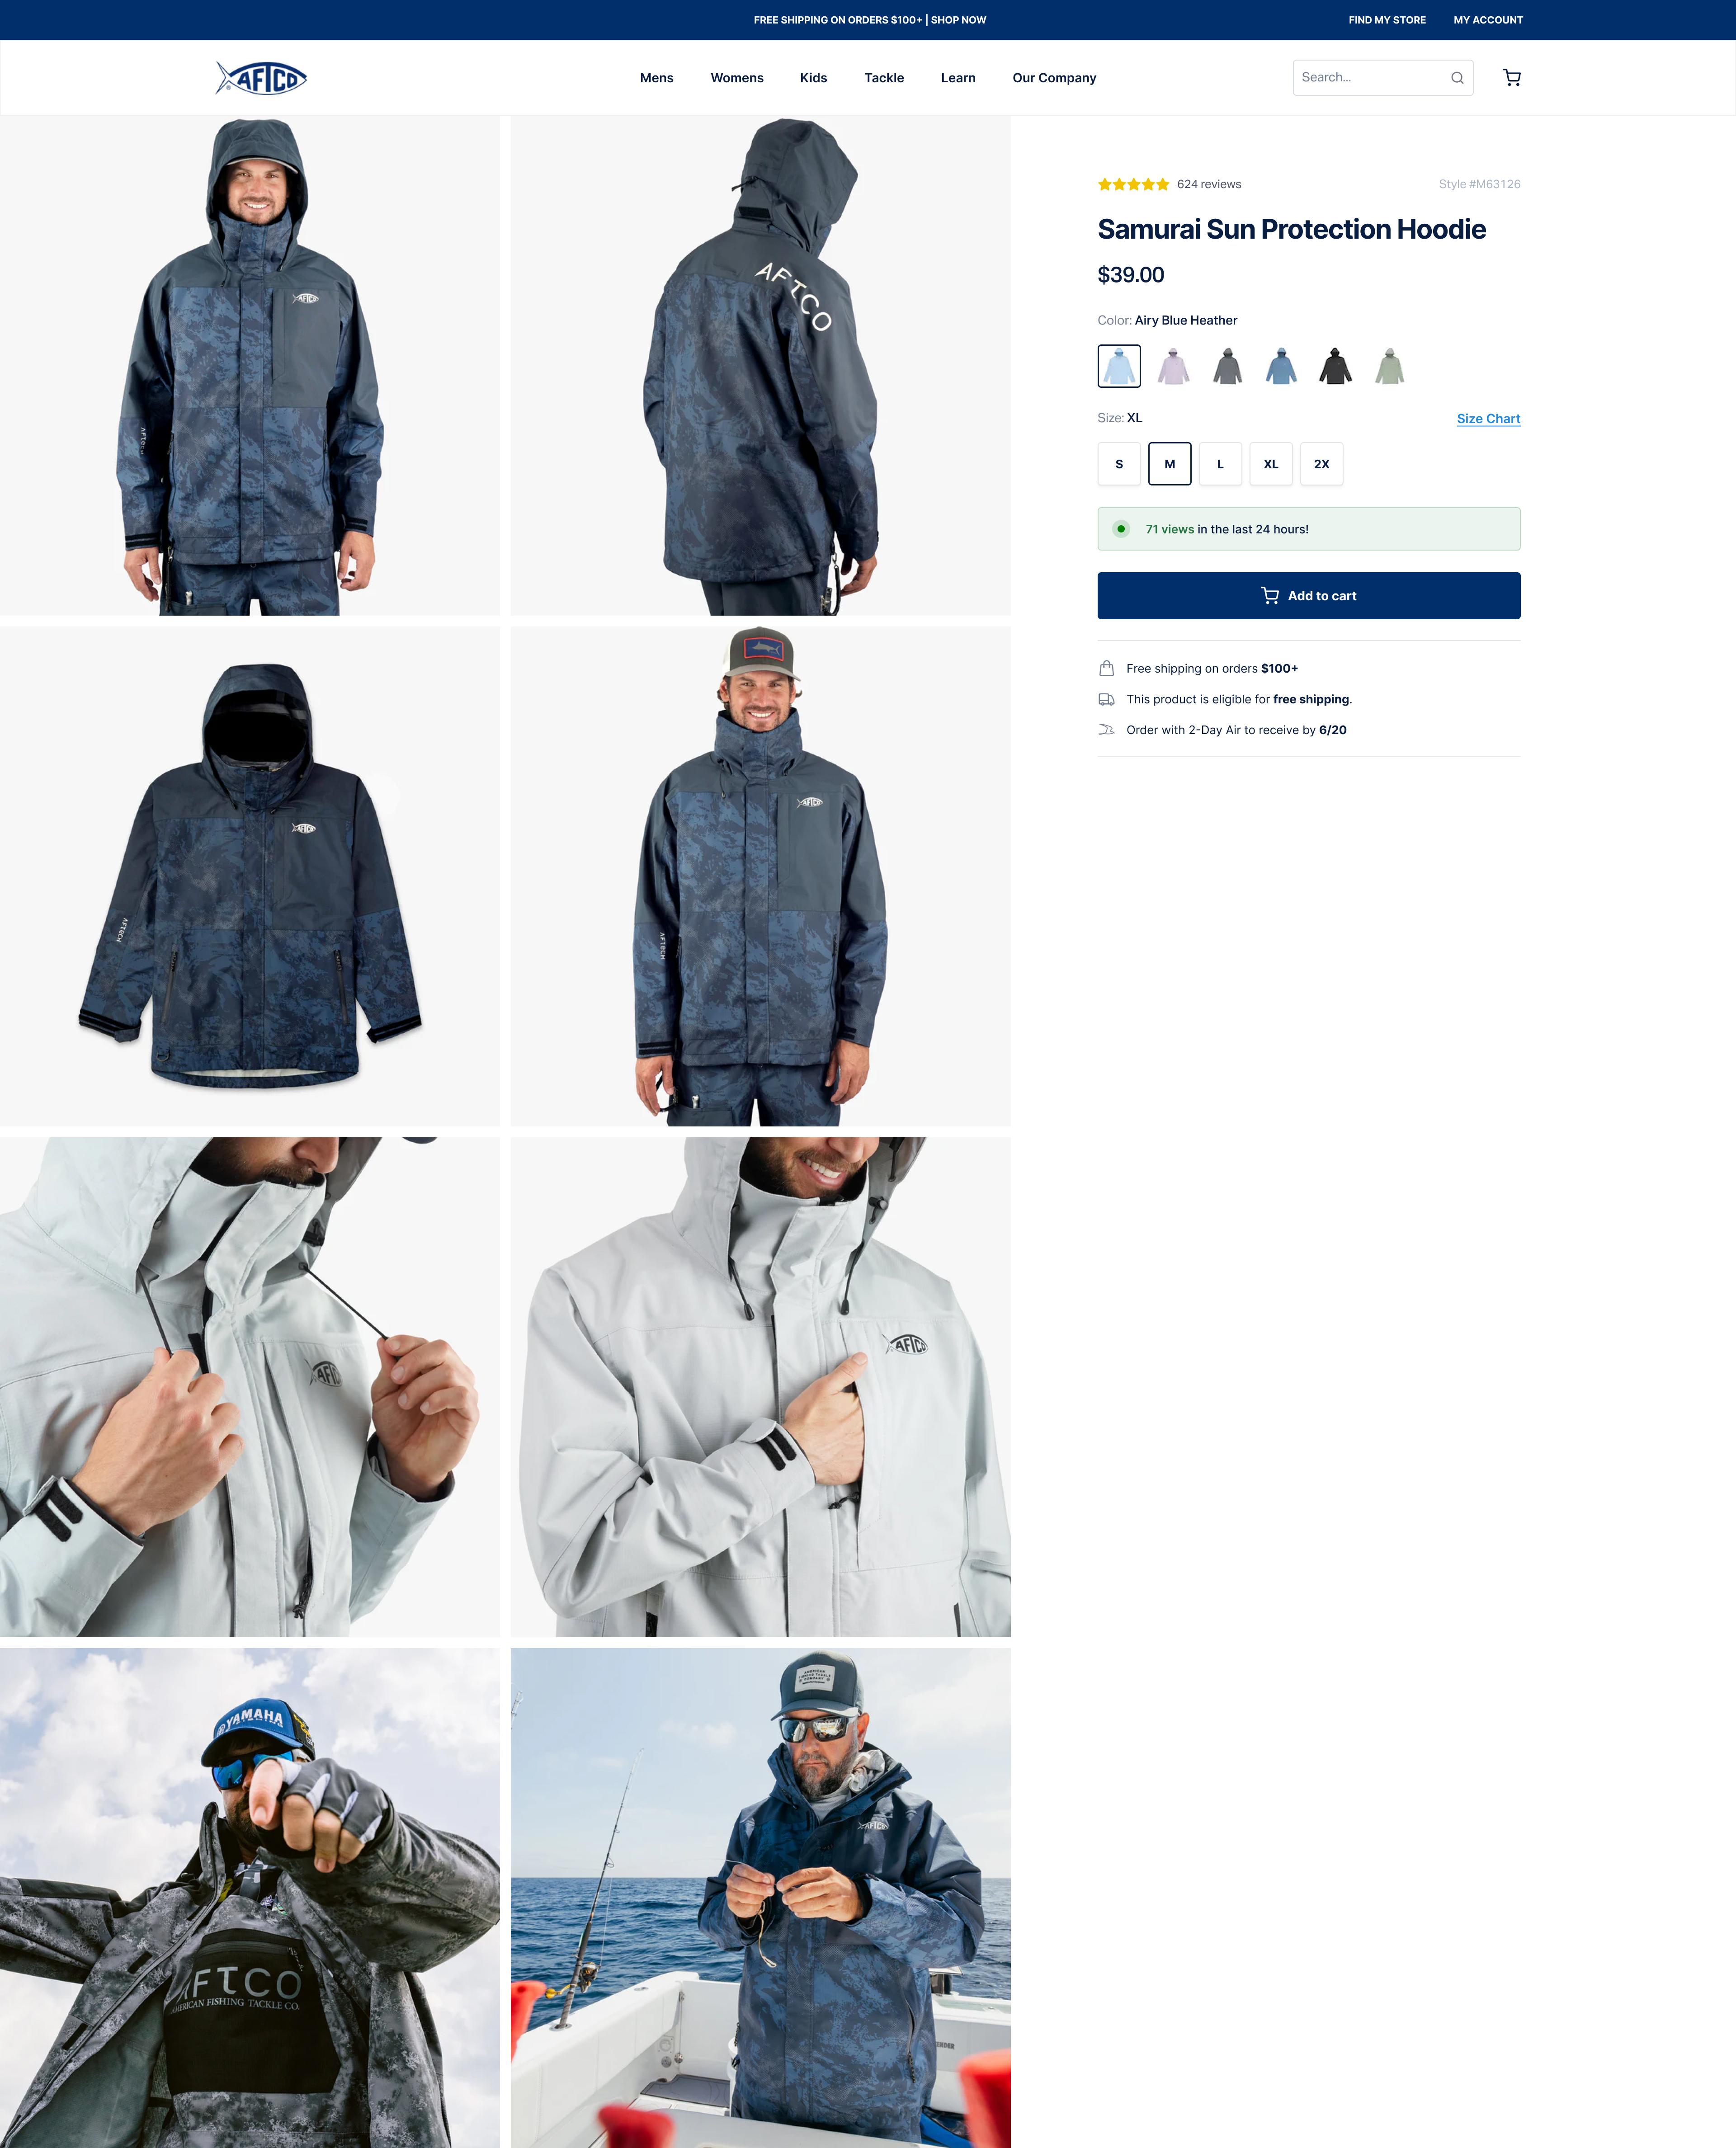
Adding Free Shipping Message Boosts Conversion and Revenue on Product Pages
Discover how adding a free shipping message transformed customer confidence, resulting in a 21% increase in conversions and enhanced shopping experiences.
+21.0%
Conversion rate
Enhanced mobile filters increase conversions and revenue
Adding the Klaviyo tracking script to the site header improved email attribution and drove a +5.0% conversion rate lift with +1.40% revenue growth.
+5.0%
Conversion rate
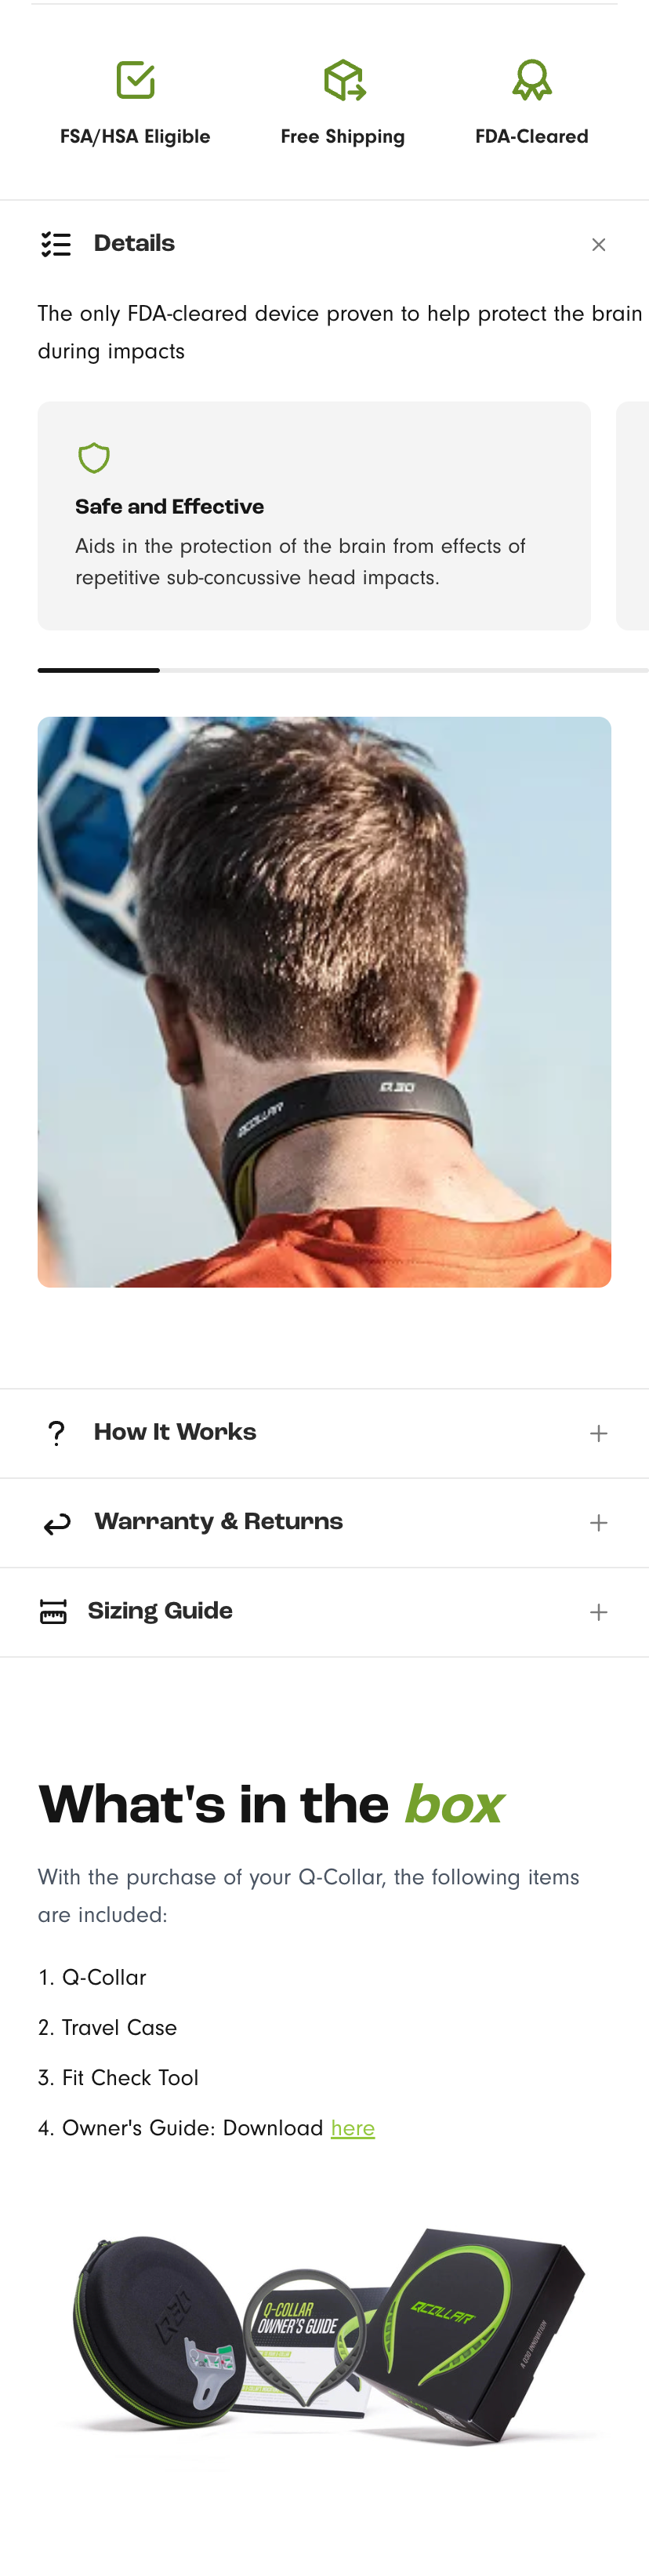
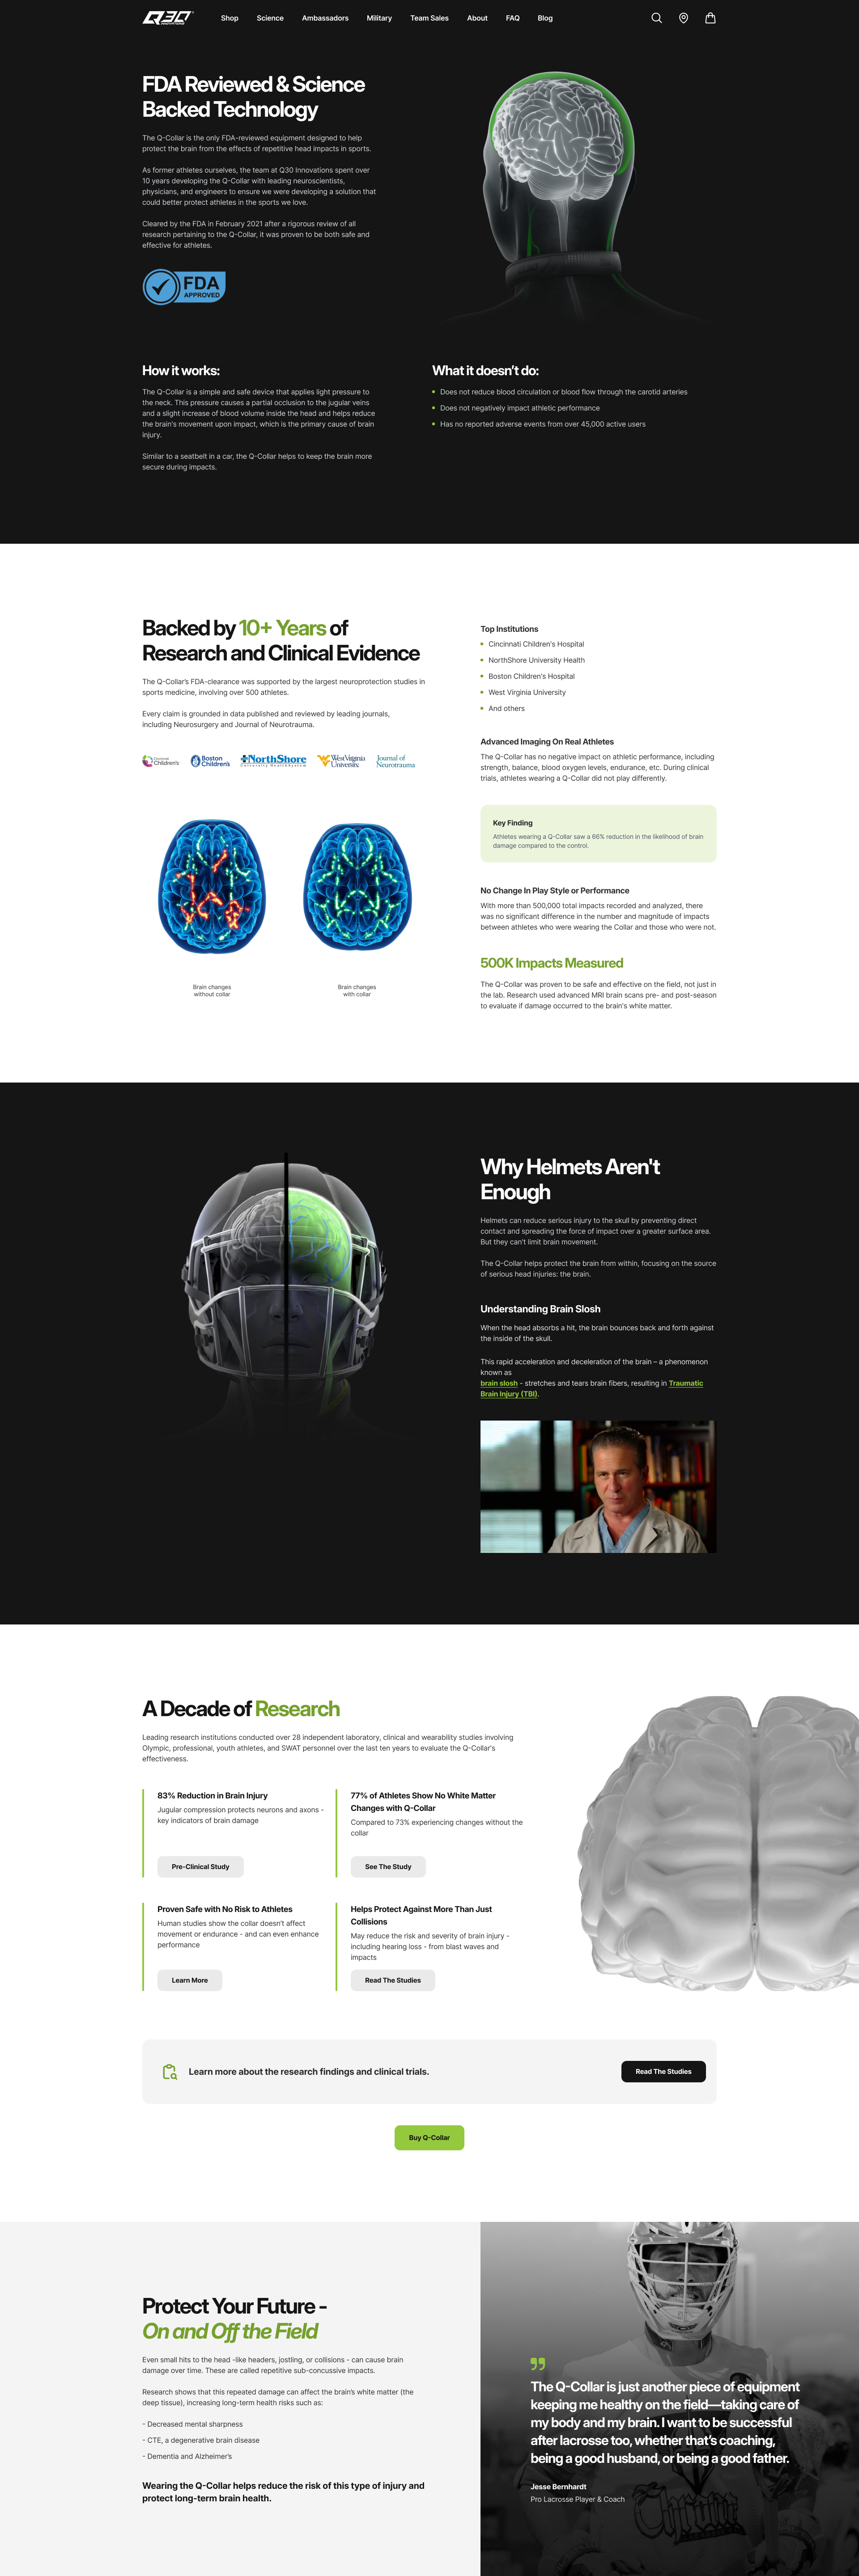
Science-backed Summary
Elevate engagement with a science summary on your homepage. Discover how this change reduced bounce rates by 5% and increased clicks by 7.9%!
-12.4%
Conversion rate
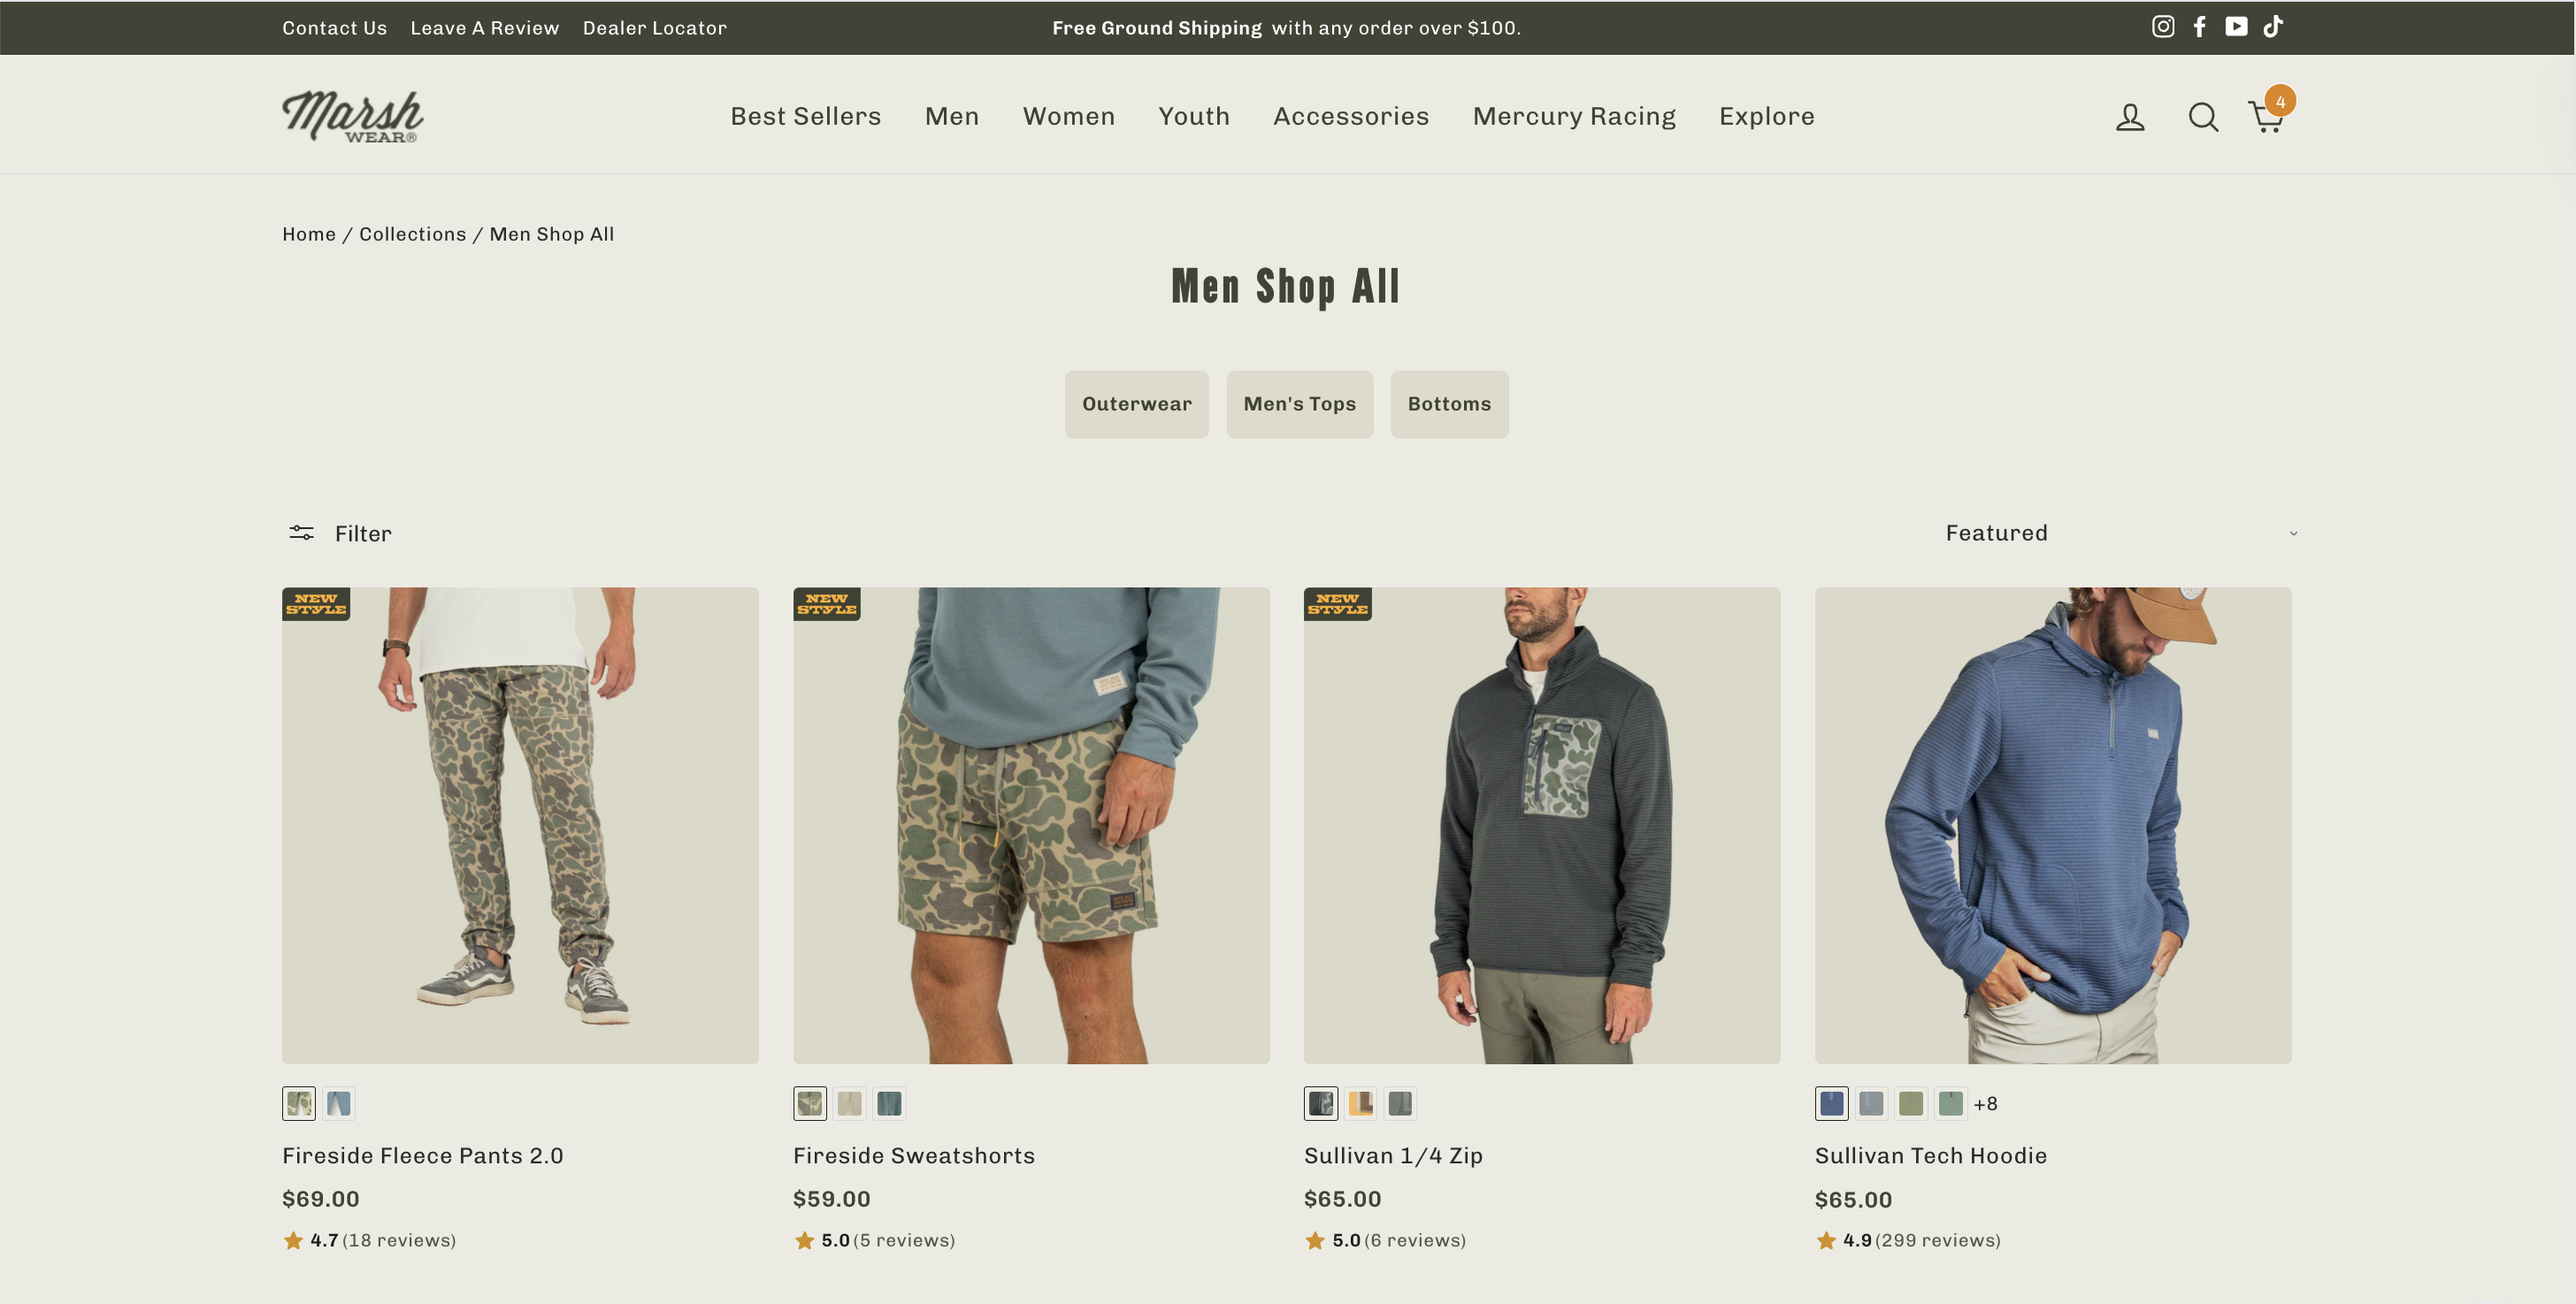
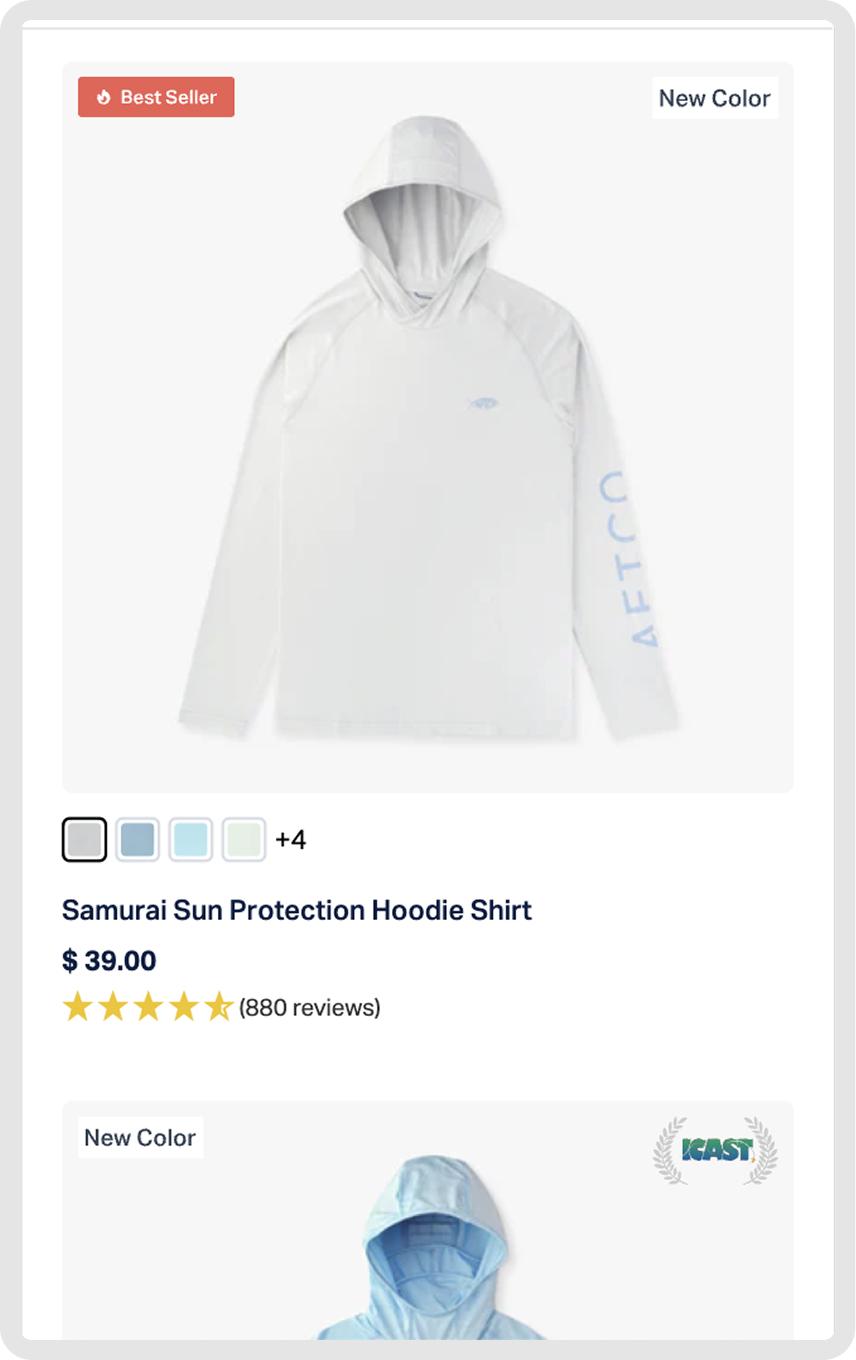
Enhanced Product Cards
Explore how redesigning collection pages influenced user engagement. Discover valuable insights!
-1.0%
Conversion rate
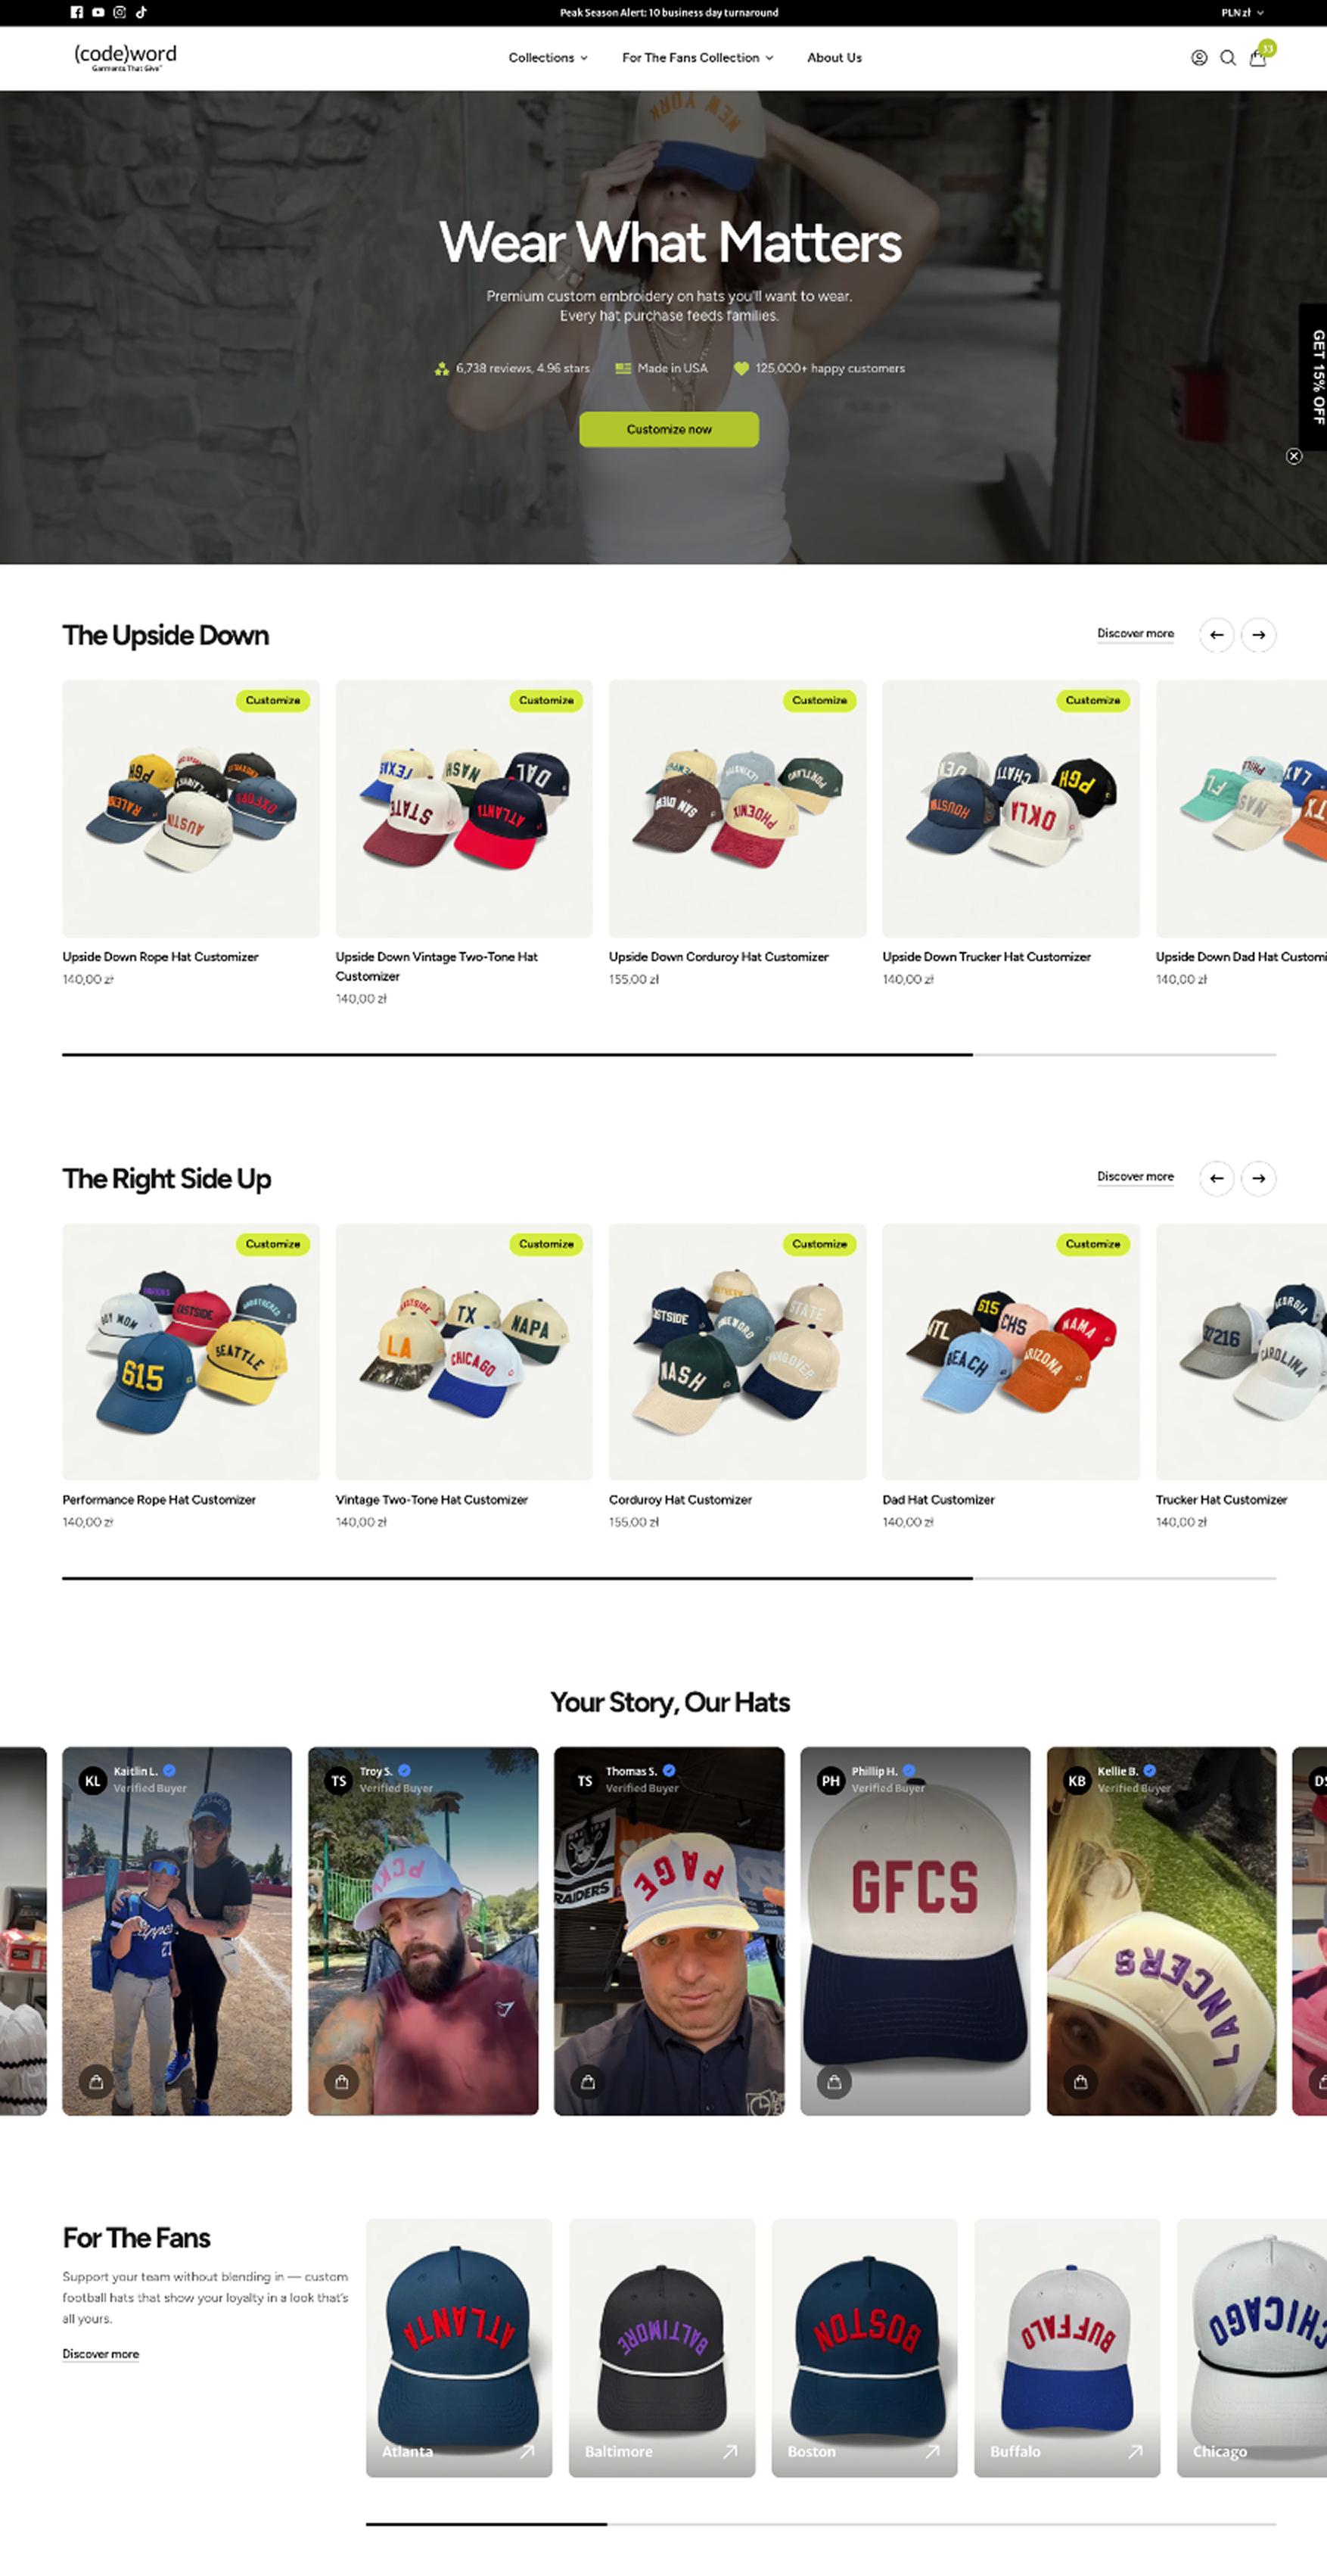
Homepage Redesign Boosts Engagement and Conversions
Discover how a redesigned homepage layout led to an 8% conversion rate increase and reduced bounce rates. Explore the effective changes made!
+8.0%
Conversion rate
Product Image Grid Layout on Desktop PDPs
Discover how a grid layout for product images on desktop enhanced user experience, leading to a 16.8% increase in conversion rates.
+3.0%
Add-to-cart rate
Promotional Bundle Message Near Add to Cart Boosts Mobile Engagement and Orders
A bundle promo message near Add to Cart boosted engagement metrics but AOV dropped -7.9% and RPV fell -11.4%, failing to drive intended upsell behavior.
-7.9%
Average order value
Minicart redesign increases checkout prominence and reduces distractions to boost conversions
Redesigning the minicart with a prominent checkout button and fewer distractions increased CTR but dropped conversion -9.9% and revenue -20.83%.
-9.9%
Conversion rate
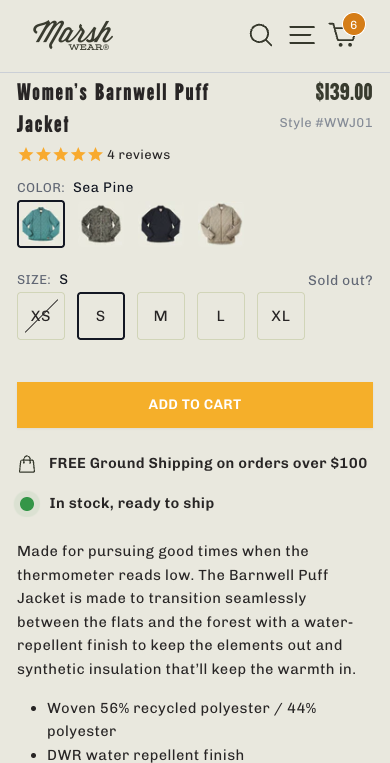
"Hand-Printed & Made with American Jobs" Badge
Discover how adding a "Hand-Printed & Made in USA" badge influenced customer engagement, leading to a significant click-through rate increase.
-2.4%
Conversion rate
Mini Cart Redesign Boosts Conversion
Discover how an updated product display led to a 7.5% increase in conversions and improved user engagement across devices. Explore the insights!
+7.5%
Conversion rate
Direct Purchase Option Boosts Football Landing Page Conversion Rates
Discover how simplifying navigation led to a 4.2% increase in conversions. Uncover key insights on enhancing user experience and engagement.
+4.2%
Conversion rate
Sticky Top Add to Cart Bar with Size Selector
Explore how mobile layout enhancements led to a 9.6% increase in conversions and a 14% rise in click-through rates, transforming user engagement.
+2.2%
Add-to-cart rate
Simplified Science Content
Discover how a mobile layout redesign led to a 21.4% increase in conversions and improved user engagement. Explore the key insights now!
+19.6%
Revenue per visitor (RPV)
Replacing Recommended Product in the Buy Now Section
Discover how a redesigned product page layout led to a 5.6% increase in conversions and enhanced user experience. Explore the full results!
+5.6%
Conversion rate
Redesigned square product cards boost mobile engagement despite mixed performance metrics
Simplified product cards on collection pages reduced CVR by -5.64% and orders by -6.5% despite a cleaner layout and slight AOV improvement.
-5.64% (CVR)
CVR
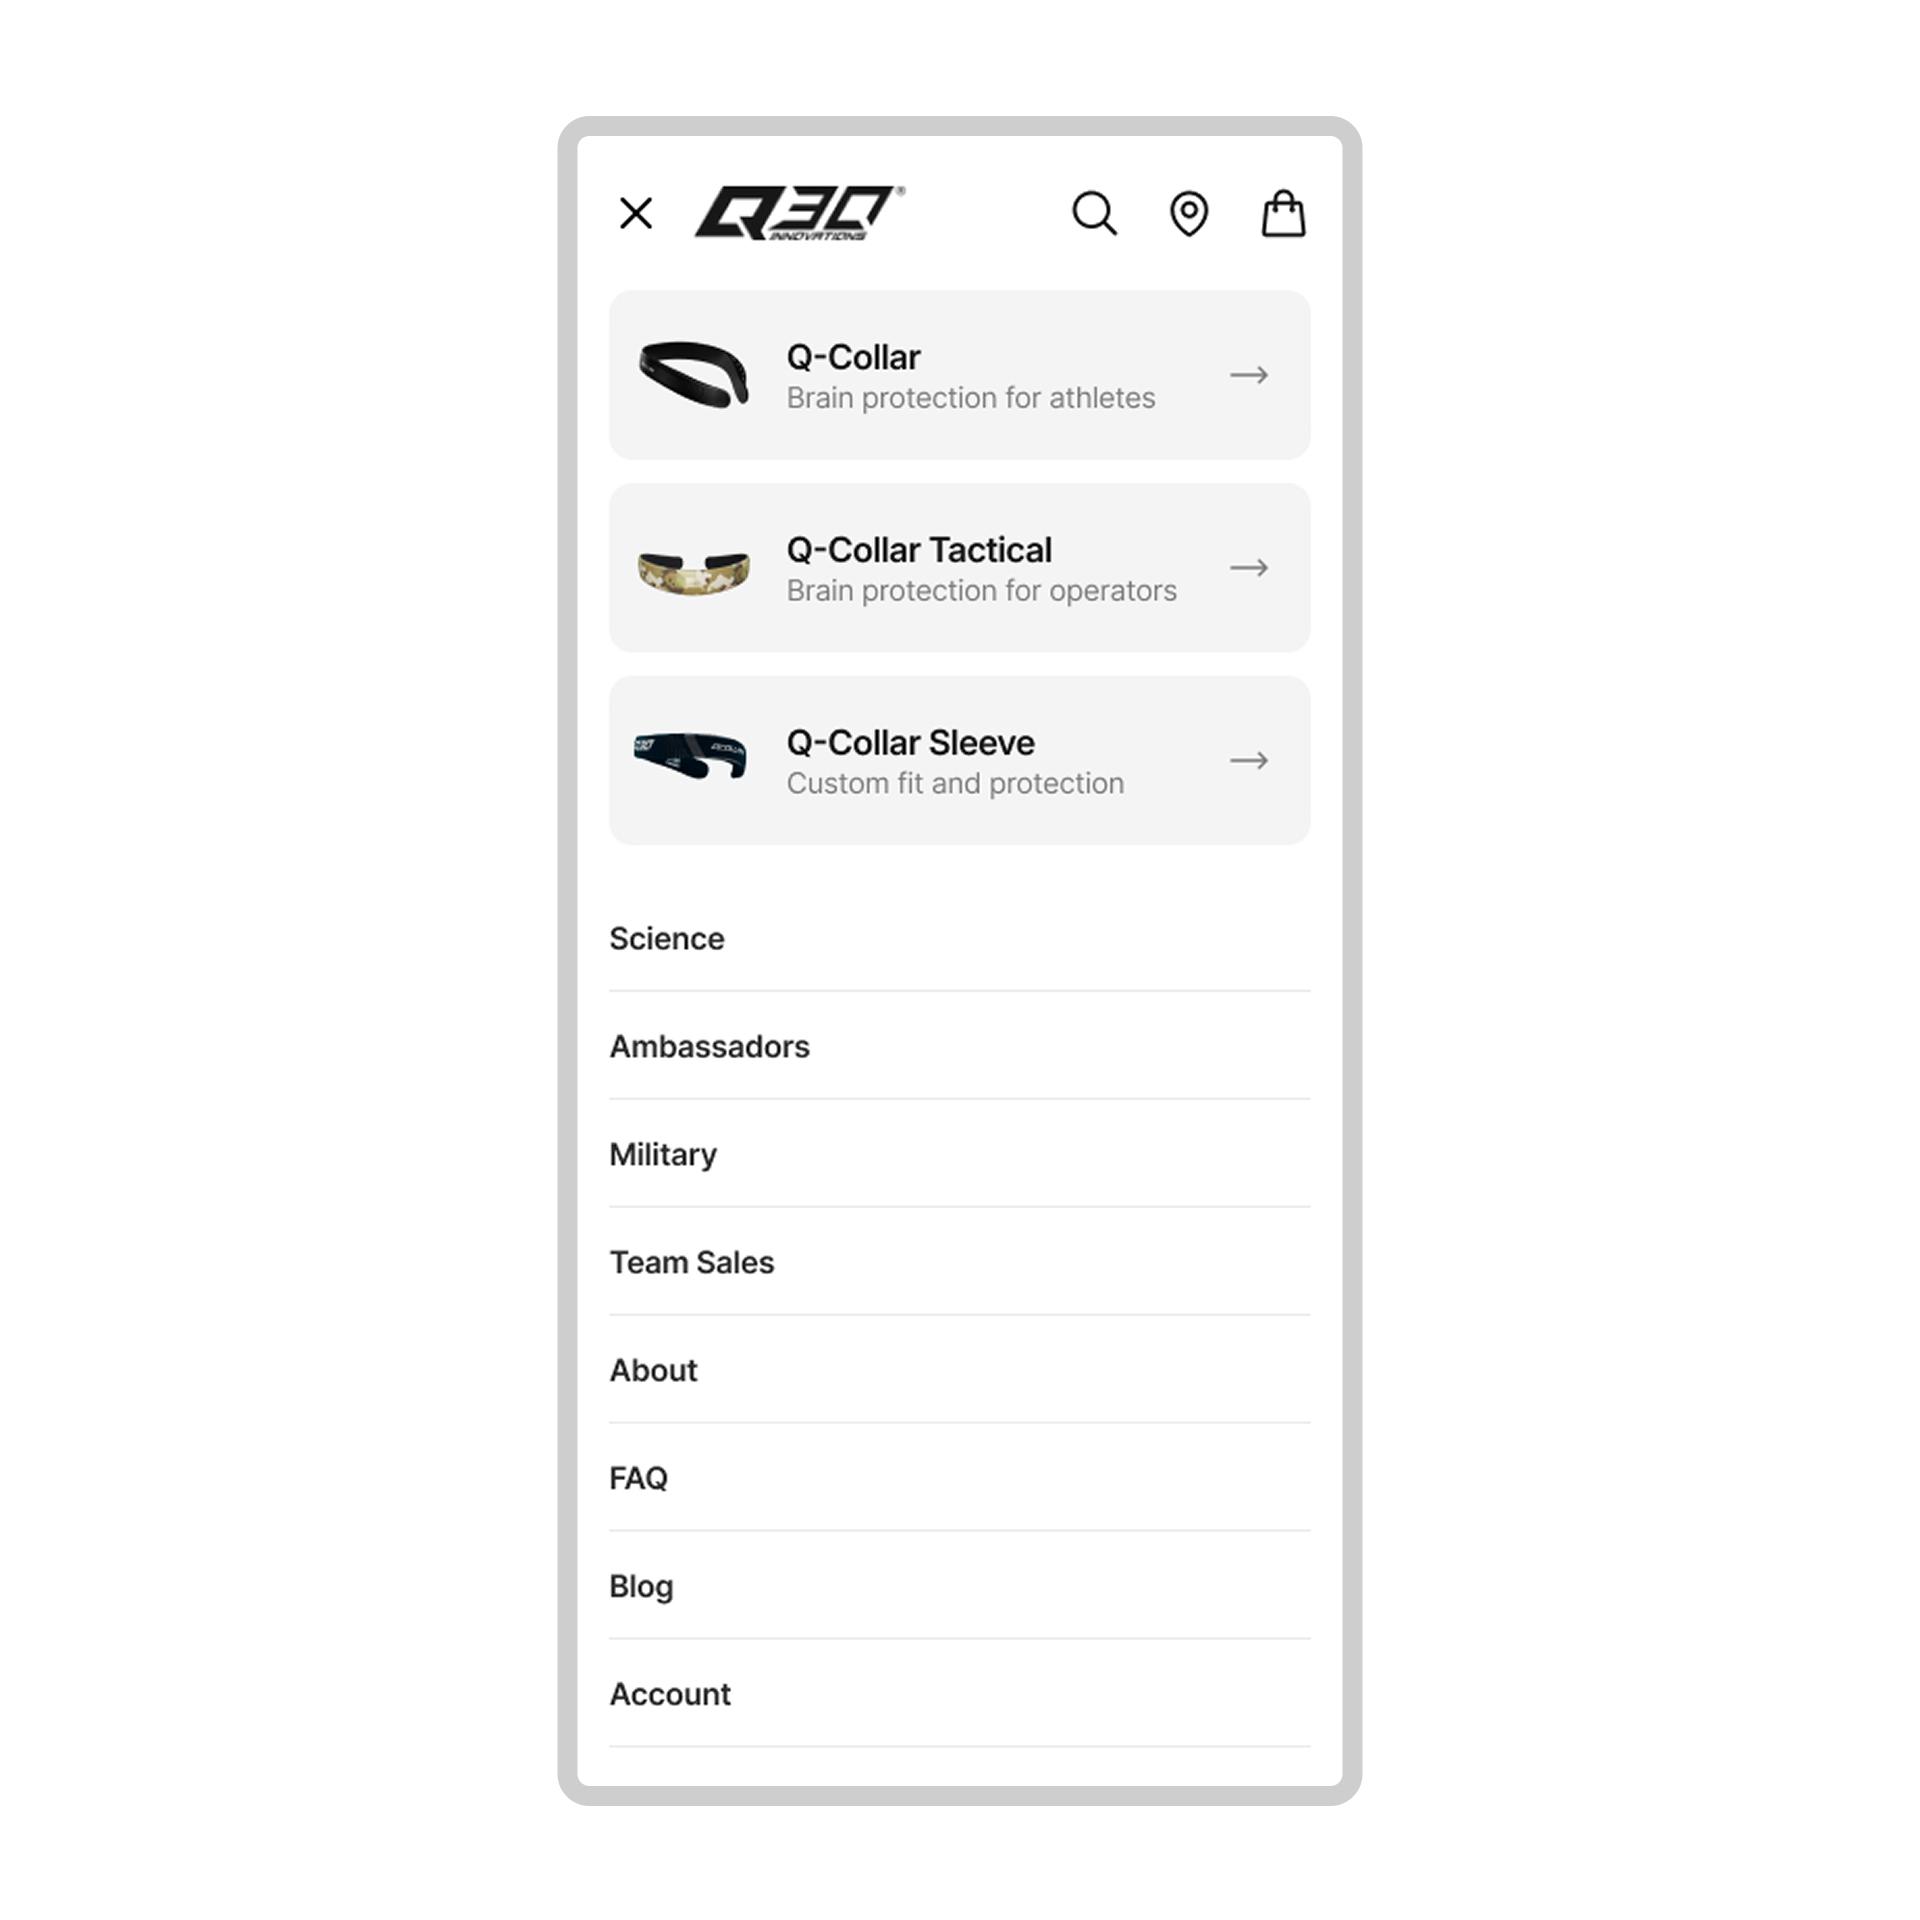
Mobile Menu Redesign
Discover how a mobile menu redesign led to a +10.7% increase in conversions, enhancing navigation and user engagement. Explore the results!
+10.3%
Conversion rate
Redesigned Product Page Enhances Visuals and User Engagement
A PDP redesign boosted engagement (CTR +21.6%, bounce -23.5%) but conversion fell -16.3%, indicating the new layout disrupted the purchase path.
-16.3%
Conversion rate
Product Card Redesign
Discover how redesigning product cards and adding a color selector led to a 4.7% increase in user engagement and enhanced browsing experience.
+1.5%
Conversion rate
Adding Category Links on Product Pages
Discover how adding product category links enhanced engagement and product discovery, leading to an 8.7% increase in click-through rates.
+8.7%
Clickthrough rate
Two-Column Filters Layout
Discover how a new two-column layout with sticky filters increased user engagement and led to a 21.9% rise in conversion rates!
+7.6%
Add-to-cart rate
Collection pages redesign with improved visuals and navigation boosts desktop revenue and engagement
A collection page redesign with improved visuals led to inconclusive CVR (-2.4%) but strong revenue (+17.55%) and AOV (+24.0%) gains.
-2.36% (CVR)
CVR
Sticky mobile filters boost product discovery and navigation accessibility
Sticky mobile filters on collection pages caused a -16.0% conversion drop despite +11.6% AOV, suggesting over-filtering and browsing flow disruption.
-16.0%
Conversion rate
Homepage product cards with swatches improve engagement and conversions
Desktop interface optimization for homepage product cards showed inconclusive primary results (-0.6% CR) but strong secondary metrics including +23.4% orders.
-0.6%
Conversion rate
Navbar Redesign with Banner Color Testing
Discover how redesigning a navbar and testing banner colors resulted in an 18.4% increase in add-to-cart actions and improved engagement.
+18.4%
Add-to-cart rate
Collection Page Redesign
Discover how a simplified product page layout led to a 4.2% increase in conversions and improved user engagement in this insightful experiment.
+4.2%
Conversion rate
Adding Customer UGC to Homepage
Discover how an updated mobile layout led to a 4.3% increase in conversions and improved user engagement. See the insights gained!
+2.1%
Clickthrough rate
Hiding Collection Links
Discover how enhancing the mobile shopping experience led to a 2.6% increase in conversions and improved user engagement. Explore the results!
+2.39% (CVR)
CVR
Visible "Free Shipping" Badge Boosts Customer Awareness and Conversion Rates
Adding a free shipping badge on PDPs for products over $99 led to a -13.17% ATC decline, possibly creating unintended price threshold awareness.
-13.17% (ACR)
ACR
Adding Free Shipping Message Boosts Conversion
Discover how enhancing mobile and desktop experiences led to a 3.7% uplift in conversion rates and improved user engagement. Explore the insights!
+3.68% (CVR)
CVR
Single-Column Product Grid
Discover how a single product card per row on mobile enhanced user engagement and led to a 3% increase in conversions. Explore the results!
+63.1%
Revenue per visitor (RPV)
Scarcity Message Boosts Cart Conversion
Discover how a simplified mobile checkout process led to a 3.2% lift in conversions and a 4.2% increase in orders for AFTCO.
+2.74% (CVR)
CVR
Implementing Returns Policy Advertising
Explore how updating the product page layout led to valuable insights for future optimizations.
-3.58% (ACR)
ACR
This is call to action
Browse experiments
Blog
Start free CRO trial
Filters
All goals
All statuses
Any lift
Clear filters